
Key HR Formulas & Benchmarks: Day 0 Cheat Sheet
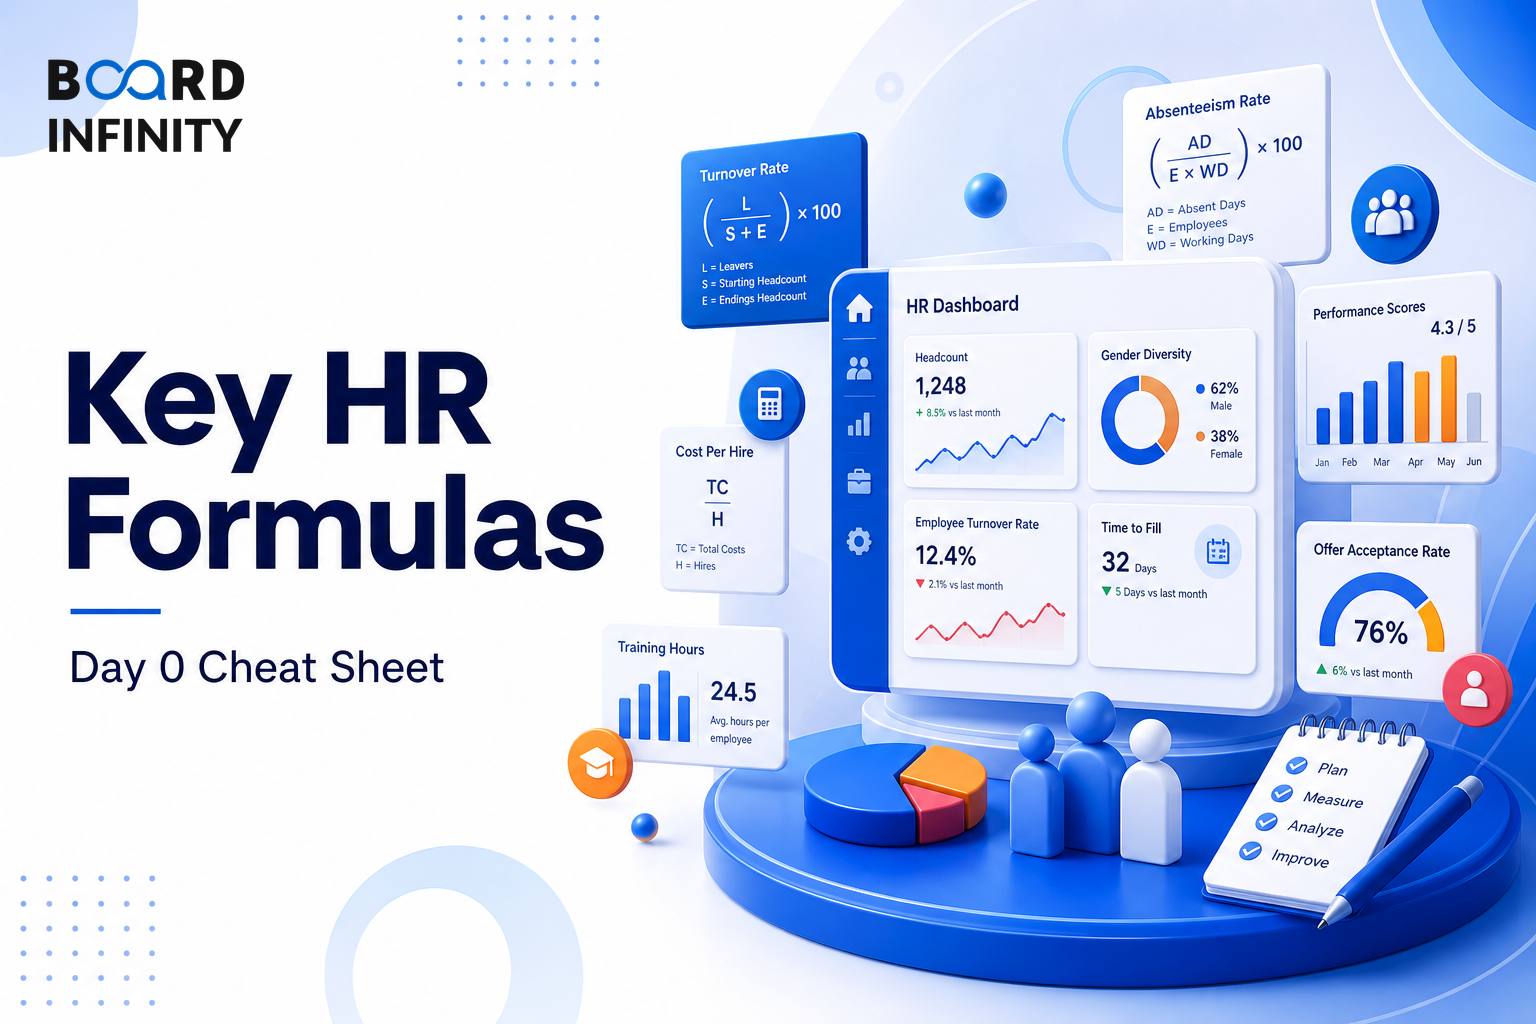
After the HR Day 0 Cheat Sheet, the next recall test is whether you know the metrics every interviewer expects you to know cold. This Day 0 cheat sheet gives you the formula, benchmark, red flag, and action for ten core workforce metrics so you can move from number recall to HRBP decision-making.
- The 10 metrics every interviewer expects you to know cold are built around formula, benchmark, red flag, and action.
- Attrition Rate uses (Leavers ÷ Avg Headcount) × 100, with 10-15% as a good range and >20% annualized as a red flag.
- Cost-per-Hire uses (Internal + External costs) ÷ Total hires, with ₹30K-₹1.5L in India and $4,700 in the US as reference points.
- Time-to-Fill uses Date offer accepted - Date requisition opened, with 30-45 days as a good range and >60 days as a red flag.
- eNPS uses % Promoters - % Detractors, where >20 is good, >50 is excellent, and <0 means more detractors than promoters.
- Knowing a formula is not enough: interpret the number, diagnose the root cause, and recommend a specific HRBP response.
Day 0 Executive Cheat Sheet
The big picture is simple: each metric must be read through four lenses - formula, good range, red flag, and HRBP action. The table below is the reference layer for quick recall and interview-ready interpretation.
How to Read the Metrics
Knowing a metric's formula is table stakes. What distinguishes a strategic HRBP is the ability to look at a number and immediately know: Is this good? Is this a warning sign? What do I do next?
The interpretation layer converts raw metric readings into actionable decisions. For example, a red flag in Time-to-Fill should not stop at saying the process is slow; the action is a stage-by-stage funnel audit, identifying dropout points, and parallelizing rounds.
Cost-per-Hire Formula Deep Dive
Cost-per-Hire = (Internal Costs + External Costs) ÷ Total Hires
Internal Costs: Recruiter salaries (prorated) + HRBP time + Assessment tools + Background verification + Interview panel time (opportunity cost)
External Costs: Agency fees (typically 8-15% of CTC) + Job board subscriptions + Campus recruitment + Relocation costs + Signing bonuses
Example: If 100 hires cost ₹75L total (internal ₹30L + external ₹45L), Cost-per-Hire = ₹75,000 per hire.
Benchmark against industry: IT services average ₹80-120K; FMCG ₹40-60K; Startups ₹1-3L for senior roles.
From Formula to HRBP Action
The action column is what turns the cheat sheet into an interview answer. Attrition Rate above the red flag needs disaggregation by regretted/non-regretted exits, stay interviews, and manager audit. Cost-per-Hire above the red flag needs channel mix audit, more referrals, and reduced agency dependency.
Revenue per Employee declining YoY points to workforce planning review, productivity programs, L&D; ROI analysis. Span of Control above 15 direct reports points to manager overload and requires org design review, manager effectiveness audit, and restructuring recommendation.
Conclusion
Use the Day 0 cheat sheet as a recall structure: formula first, good range second, red flag third, and HRBP action last. The final takeaway is that metrics matter because they connect workforce signals to practical decisions.
The most frequent error is stopping at the formula. Knowing a metric's formula is table stakes; what costs points is failing to interpret the number, diagnose the root cause, and recommend a specific HRBP response.
