
Mapping a Value Chain and Finding the Profit Pool
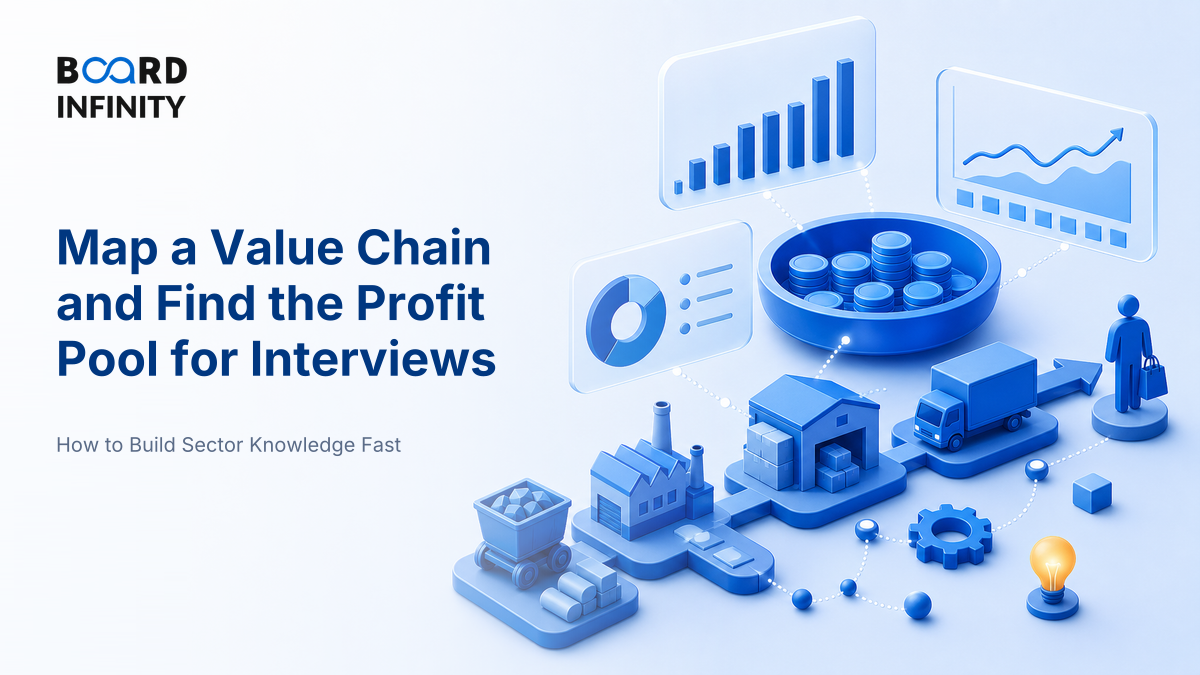
From outside, a smartphone looks like one product sold by one brand. Open the value chain and the picture changes: chip designers, component makers, assemblers, logistics partners, retailers, financiers, app stores and service networks all touch the customer - but they do not all capture the same profit.
- A value chain maps activities from inputs to customer use, showing who performs each step and how value is added.
- A profit pool maps profit, not revenue. A large revenue stage can still be a low-profit stage if margins are thin.
- The core move is: list stages - identify players - estimate economics - locate control points - infer who wins.
- Profit pools usually form around scarcity, customer ownership, regulation, data, brand, switching costs or capital control.
- Use metrics like gross margin, operating margin, ROIC, asset turnover, cash conversion cycle and take rate to test your view.
- The best interview answers compare where value is created with where profit is captured.
- The biggest trap: assuming the company closest to the customer automatically earns the most money.
Big Picture - The Value Chain Shows Work; the Profit Pool Shows Money
A value chain is the sector’s operating map. A profit pool is the sector’s economic heat map. Put them together and you can explain why two companies in the same industry can have completely different margins, risks and bargaining power.
Core Explanation - How to Map a Value Chain and Find the Profit Pool
Start with a simple question: who does what before the customer gets value? Then ask the harder question: who keeps the profit after everyone is paid?
Michael Porter introduced the value chain framework in Competitive Advantage, showing that advantage can come from how a firm performs strategically important activities. For sector analysis, you widen the lens from one firm to the entire industry system.
The Five-Step Process
This process is especially powerful when you combine it with sector-specific metrics. If you are not sure which measures matter in a sector, revise Finding the Metrics a Sector Is Actually Judged On before building your final view.
Value Chain vs Profit Pool - Do Not Confuse the Two
Where Profit Pools Usually Form
Profit rarely spreads evenly. It collects where a player controls something scarce or hard to replicate. A distributor may handle huge volume but earn thin margins; a brand owner may touch fewer physical assets but capture stronger economics because customers actively prefer it.
Common control points include:
- Brand trust: the customer pays a premium because alternatives feel risky or inferior.
- Distribution access: shelf space, dealer networks, dark stores, payment rails or app placement become gates to demand.
- IP or technical capability: patents, design know-how, process quality or proprietary models raise switching costs.
- Regulatory permission: licences, compliance capability or capital requirements restrict entry.
- Data and feedback loops: better demand prediction, underwriting, pricing or personalization improves unit economics.
- Capital advantage: cheaper capital or better working-capital cycles allow a player to scale where others struggle.
Metrics to Track When Locating a Profit Pool
Use metrics to prevent story-led answers. A profit pool must show up in margins, returns, cash conversion or unit economics. Benchmarks vary sharply by sector, so the strongest test is always relative to direct peers in the same stage of the chain.
If these metrics feel abstract, connect them to how a business model makes money. The natural next layer is Reading a Business Model as a Set of Economics.
Worked Example - A Hypothetical Profit Pool Map
Suppose a ₹1,000 crore consumer electronics category has four broad stages. The revenue pool is not the same as the profit pool.
Total operating profit is ₹88 crore. Brand and marketing has only 30% of category revenue but captures ₹45 crore, or just over half the profit. Assembly handles a large physical role but captures a much smaller pool because competition, buyer power and thin conversion margins limit economics.
“The attractive stage is not necessarily the largest revenue stage. I would compare operating profit, ROIC and control points by stage, then test whether the profit pool is protected or likely to migrate.”
Definitions
- Value chain: A sequence of activities that creates, delivers and supports value for the final customer.
- Profit pool: The total profit earned across a sector, mapped by stage, player type or customer segment.
- Control point: A scarce capability or position that lets a player influence price, access, cost or customer choice.
- Margin pool: The profit available at one stage after direct costs, overheads and operating requirements.
Case Study - Dixon Technologies and the Electronics Manufacturing Chain
Dixon Technologies shows how an Indian manufacturing player can occupy a critical value-chain position even when the consumer-facing brand captures a different part of the profit pool.

Situation: In consumer electronics, the customer may remember the brand on the box, but the product often passes through a larger system of component suppliers, contract manufacturers, logistics partners, retailers and service networks. Dixon Technologies describes itself as an electronics manufacturing services company serving categories such as consumer electronics, home appliances, lighting, mobile phones and security systems on its corporate website.
The move: Dixon’s position is not to own every consumer brand. Its role is to provide manufacturing capability, scale, process discipline and customer-specific production for brand owners. The primary driver is manufacturing execution at scale. Supporting drivers include category diversification, relationships with multiple customers, process quality, operating discipline and the ability to fit into India’s electronics manufacturing ecosystem.
The profit-pool lesson: The electronics chain has multiple profit pools. Brand owners may capture profit through customer trust, pricing and distribution. Component makers may capture profit if they control scarce technology. Manufacturers capture profit through scale, efficiency, utilization and execution reliability. Dixon is interesting because it reminds you that a stage can be strategically important even when it is not the most visible stage to the end customer.
So what: A shallow answer says “brands make the money.” A stronger answer says “profit may sit with brands, component owners or efficient manufacturers depending on scarcity, margin, capital intensity and control points.”
How AI Changes Mapping a Value Chain and Finding the Profit Pool
AI does not replace sector judgment, but it makes the first map faster and the blind spots easier to catch.
- Faster chain discovery: AI tools can scan annual reports, investor presentations and regulator notes to extract suppliers, customers, channels, cost drivers and segment language. The risk is hallucination, so every claim must be checked against the original document.
- Profit-pool pattern recognition: AI can compare stage-level economics across listed peers and flag where margins, working capital or ROIC diverge. The human judgment is explaining why the difference exists.
- Interview preparation from real documents: Load a company annual report and your sector notes into NotebookLM, then ask: “Create a value-chain map, list likely profit pools, and generate 10 interview questions with evidence from the document.” Use Reading an Annual Report for Sector Insight to know what to verify before trusting the output.
AI is good at producing a neat-looking chain. It is weaker at knowing whether a margin is structurally attractive, temporarily inflated or distorted by accounting. Always validate with peer metrics and primary sources.
Interview Relevance
“Pick any sector you know. Map its value chain and tell me where the profit pool lies.”
Use one sentence to separate activity from economics: “This stage is operationally important, but the profit pool is stronger elsewhere because bargaining power and differentiation sit there.” That sentence sounds senior.
Common Mistake
The mistake: mapping the value chain as a list of companies and then declaring the biggest or most famous company as the profit-pool winner. Why it costs you: it shows you have not separated revenue, margin, capital intensity and control. One-line fix: always ask, “Who captures profit after cost, capital and risk - and why can they keep it?”