
Normalisation & Denormalisation: What Each One Costs You
A messy `Orders` table looks wonderfully simple on day one: customer name, phone number, product name, price and delivery city in one long row. Six months later, one customer changes address and the same fact must be updated in fifteen places - that is where database design stops being theory and starts costing money.
- Normalisation splits data into related tables so each business fact is stored once and stays consistent.
- Denormalisation deliberately repeats or precomputes data to make reads faster and simpler.
- Normalisation costs you joins, query complexity and sometimes read latency.
- Denormalisation costs you storage, update complexity, data drift and reconciliation effort.
- Use normalisation for OLTP systems where correctness matters - orders, payments, inventory, customer master data.
- Use controlled denormalisation for read-heavy use cases - dashboards, search, recommendation feeds and analytics tables.
- The best answer is not “normalise everything” or “denormalise for performance”; it is normalise the source of truth, denormalise the read path.
The Big Picture: One Fact vs One Fast Screen
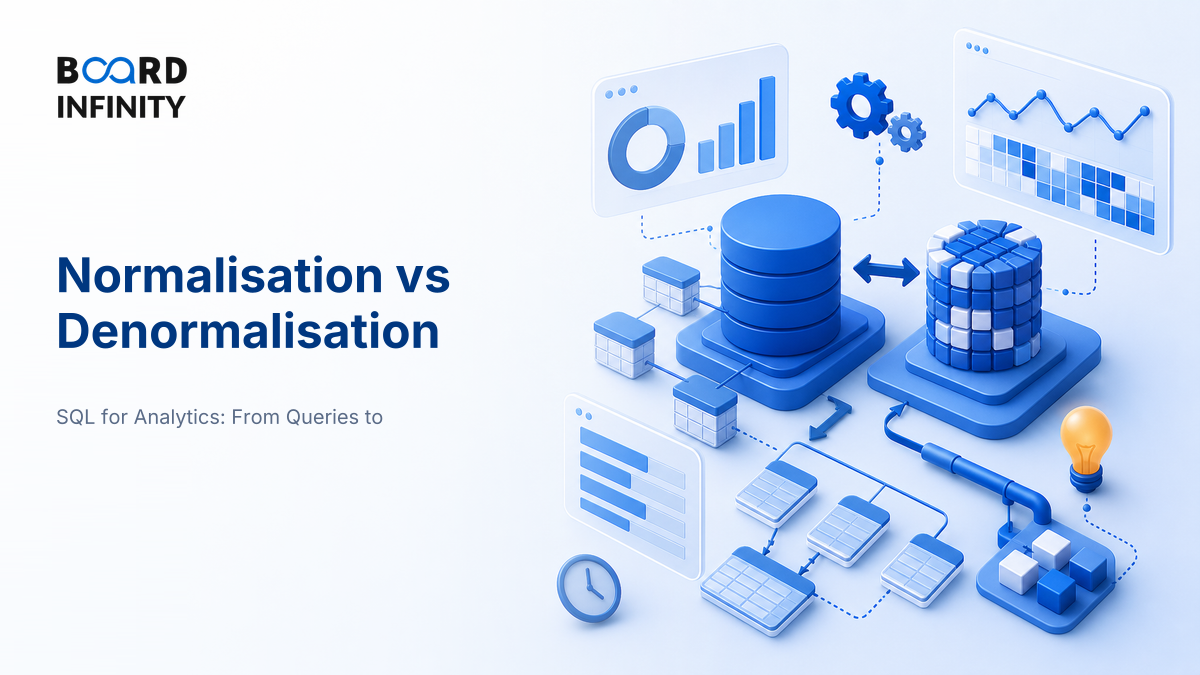
Normalisation and denormalisation are not enemies. They are two design choices serving different jobs: one protects the truth of the data, the other protects the speed of access. Good systems often use both.
Core Explanation: What Each One Costs You
The cleanest mental model is this: normalisation pays read cost to reduce write risk; denormalisation pays write and governance cost to reduce read cost.
1. Normalisation: What It Solves
Normalisation breaks a large table into smaller related tables using keys. The goal is to reduce three classic anomalies:
- Update anomaly: the same customer phone number appears in many rows, so one update may miss some rows.
- Insert anomaly: you cannot add a product unless an order exists for it.
- Delete anomaly: deleting the last order for a product also deletes the only product information.
2. Denormalisation: What It Buys
Denormalisation is not “bad design”. It is a conscious performance trade-off. You repeat data or precompute results because the system has to answer a query quickly and repeatedly.
Common denormalisation patterns include:
- Duplicate attributes: store `customer_city` in an `orders_summary` table so order dashboards do not join customer tables.
- Precomputed aggregates: store daily sales, cart totals or wallet balances instead of calculating from raw events every time.
- Materialised views: persist a query result and refresh it on schedule or on change.
- Wide analytics tables: combine dimensions and facts for BI tools such as Power BI, Tableau or Looker.
- Search indexes: copy product or content data into Elasticsearch, OpenSearch or Solr for fast retrieval.
3. The Cost Decision: When to Use Which
Do not decide based on personal preference. Decide based on workload: how often the data changes, how painful inconsistency is, and how fast the read must be.
4. Metrics to Track Before You Denormalise
Denormalisation should be justified with evidence. Track these measures before and after the change.
Worked Example: The Hidden Cost of Repeating Customer City
Suppose an e-commerce database has 200,000 customers and 1,000,000 orders. On average, each customer has 5 orders.
- Normalised design: `customer_city` is stored once in `Customers`. If the city value takes 20 bytes, storage is 200,000 x 20 = 4 MB.
- Denormalised design: `customer_city` is also stored in every `Orders` row. Storage is 1,000,000 x 20 = 20 MB.
- Extra storage: 20 MB - 4 MB = 16 MB for this one repeated attribute.
- Update cost: if 4,000 customers change city, the normalised design updates 4,000 rows; the denormalised order table may need up to 20,000 row updates.
The storage number looks small in this toy example. The real cost is operational: more updates, more indexes touched, more chances that dashboard data disagrees with master data.
Definitions
- Normalisation: organising relational data so each fact is stored once, reducing redundancy and update anomalies.
- Denormalisation: deliberately storing redundant or precomputed data to reduce joins and speed up reads.
- Functional dependency: a relationship where one attribute value determines another attribute value.
- Primary key: a column or column set that uniquely identifies each row in a table.
- Foreign key: a column that links one table to the primary key of another table.
A useful 3NF memory line is: every non-key fact should depend on the key, the whole key and nothing but the key. It is a mnemonic, not a substitute for understanding dependencies.
Razorpay: Keeping Payment Truth Separate from Merchant Dashboard Speed
Razorpay is a useful Indian case because digital payments require exact records, but merchants also expect fast dashboards and reconciliation views.
This is not a claim about Razorpay’s private table design. The point is that Razorpay’s business category makes the normalisation-denormalisation trade-off very visible: every payment, refund, settlement and dispute needs a reliable source of truth, while merchants want quick answers such as “How much did I receive today?” or “Which settlements are pending?”

The primary driver of a strong design in this category is separation of concerns: keep core payment and settlement records normalised and auditable, then serve fast screens through controlled read models. Supporting drivers include idempotent transaction handling, reconciliation jobs, audit trails, indexes, caching and clearly defined refresh rules.
The lesson is interview-ready: for regulated or money-moving systems, normalise the truth and denormalise only the consumption layer. The win does not come from one factor alone; it comes from a correct source of truth supported by fast read paths, reconciliation and operational discipline.
How AI Changes Normalisation & Denormalisation
AI does not remove the need to understand schema design. It changes how quickly teams can inspect workloads, propose designs and detect data drift.
- Workload-aware schema suggestions: AI coding assistants can inspect query logs and suggest indexes, materialised views or denormalised tables for repeated expensive joins. The human decision remains crucial because AI may optimise speed while ignoring correctness risk.
- Natural-language data modelling: Analysts can describe entities such as customer, order, payment and refund, then ask an LLM to draft an entity-relationship model. This is useful for first drafts, but you must validate keys, dependencies and update paths.
- Data quality monitoring: ML can flag unusual mismatches between source tables and derived summary tables, especially in dashboards and finance reporting pipelines.
Use ChatGPT or Claude with a small sample schema: paste 5-6 table definitions, describe the top three queries, and ask, “Which tables should remain normalised, where would denormalisation help, and what data-drift checks should I add?” Then verify the answer against keys, dependencies and business risk.
Interview Relevance
“Explain normalisation and denormalisation. If you are designing an order management database for an e-commerce company, when would you use each?”
Use the phrase “source of truth versus read model”. It signals that you understand both database correctness and business performance.
Common Mistake
The biggest mistake is giving a one-sided answer: “normalisation is good, denormalisation is bad.” That sounds textbook but weak. The fix: say normalise where correctness and updates matter; denormalise where repeated reads need speed, with reconciliation controls!
What to Revise Next
Next, connect schema design to how SQL actually runs. Revise Query Execution Order and Why It Explains Most Errors first, then move to Filtering Precisely: SELECT, WHERE, IN, LIKE & BETWEEN. Together, these explain why a clean database design still needs precise querying.