
Sampling, Sampling Bias & the Central Limit Theorem
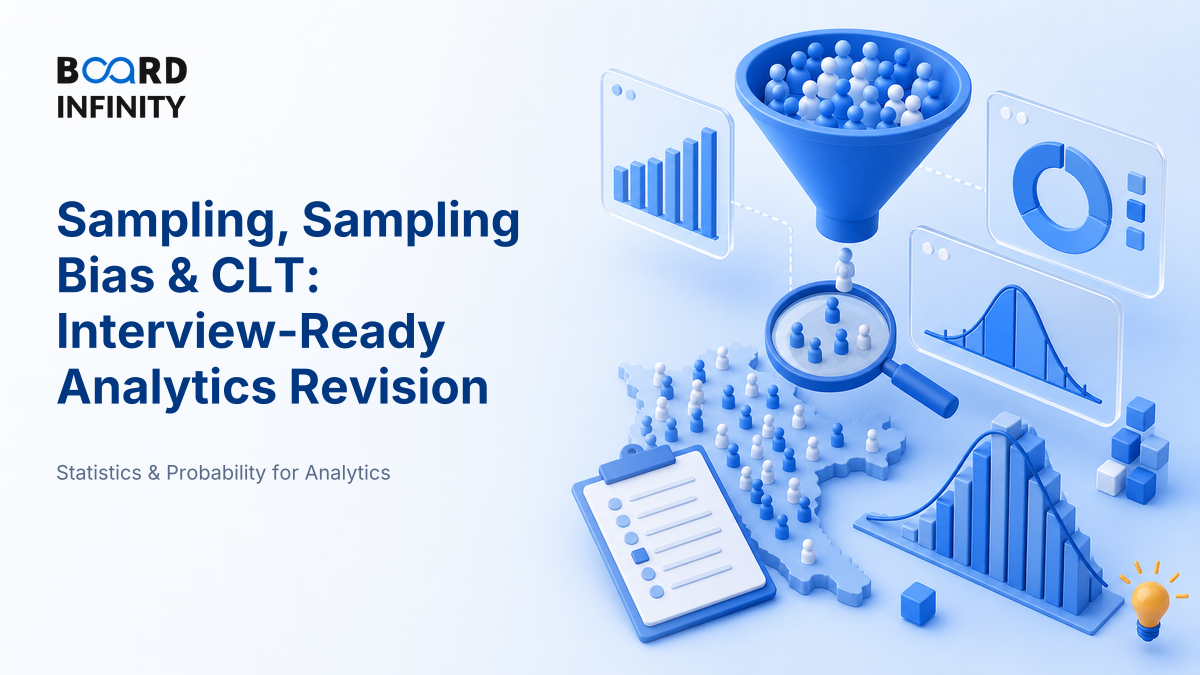
What if 10,000 survey responses are less useful than 400? That is exactly what happens when the wrong people answer - your sample looks impressive, but your conclusion is quietly broken.
- Sampling means studying a subset of a population to estimate something about the whole population.
- A good sample is not just large - it is representative, randomly chosen where possible, and measured consistently.
- Sampling bias occurs when some population members are systematically over-represented or under-represented.
- The Central Limit Theorem says large random sample means become approximately normal, even if the population is not normal.
- CLT reduces random error through larger sample size, but it does not fix bias.
- Use standard error to quantify sampling uncertainty: for a mean, SE = sample standard deviation / √n.
- The safest interview line: "First check representativeness and bias, then use CLT to quantify uncertainty."
Big Picture
Sampling is the bridge between messy reality and confident decisions. You rarely observe every customer, voter, transaction or employee. So you select a sample, calculate a statistic, and infer a population parameter - but only if the sample was chosen in a way that lets inference work.
Core Explanation
The core idea is simple: a sample is useful when its errors are mostly random, not systematic. Random error can be estimated and reduced. Systematic error - bias - can quietly ruin the decision.
Suppose a food delivery app wants to know average delivery time in Bengaluru. Observing every order may be costly, so it samples 1,000 orders. If those orders are randomly selected across zones, times of day and restaurants, the estimate can be trusted. If the sample includes only premium neighbourhoods or only lunch orders, the number is biased even if n = 10,000.
Sampling Terms You Must Not Confuse
- Population: the full group you want to understand, such as all active customers in India.
- Sampling frame: the accessible list you sample from, such as users with a valid phone number.
- Sample: the subset actually observed.
- Parameter: the true population value, such as actual average delivery time.
- Statistic: the sample value used to estimate the parameter, such as sample average delivery time.
Types of Sampling
Interviewers usually care less about memorising names and more about knowing when a method is safe. The dividing line is whether every member has a known chance of selection.
Sampling Bias: The Silent Killer
Sampling bias is not "having a small sample." It is selecting a sample in a way that systematically differs from the population. Large biased samples become confidently wrong.
Common Sources of Sampling Bias
- Coverage bias: your sampling frame excludes part of the population, such as offline shoppers missing from an app-only survey.
- Selection bias: people self-select into the sample, such as only angry customers filling a complaint form.
- Non-response bias: selected people do not respond, and non-responders differ from responders.
- Survivorship bias: you study only the "survivors," such as successful start-ups, and ignore failed ones.
- Response bias: people answer inaccurately because of social desirability, memory errors or question wording.
The Central Limit Theorem, Plainly
The Central Limit Theorem is why sampling powers business analytics. If you repeatedly take large random samples and calculate the mean each time, those sample means form an approximately normal distribution around the true population mean.
Two practical consequences matter:
- Sample means become predictable: you can use normal curve logic even when individual observations are skewed.
- Standard error falls as sample size rises: for a mean, SE = s / √n, where s is sample standard deviation and n is sample size.
Worked Example: Delivery Time Estimate
A food delivery app samples 100 completed orders. The sample average delivery time is 32 minutes and the sample standard deviation is 8 minutes.
How to Judge Sample Quality: 6 Practical Measures
Use these as interview thumb-rules. Exact targets vary by industry, but the formulas show that you understand measurement, not just theory.
Definitions You Can Say in One Breath
- Population: the complete group of units about which a study wants to draw conclusions.
- Sample: a subset of the population selected for observation or measurement.
- Sampling frame: the list or mechanism from which the sample is actually drawn.
- Parameter: a numerical characteristic of a population, such as its true mean or proportion.
- Statistic: a numerical characteristic calculated from a sample.
- Sampling bias: systematic error caused when the sample does not represent the target population.
- Central Limit Theorem: large random sample means are approximately normally distributed, regardless of the population shape.
Case Study: Axis My India and the 2024 Lok Sabha Exit Poll Lesson
Axis My India shows why a very large field survey can still struggle if response behaviour, turnout patterns and weighting do not fully reflect the population.

Exit polling is one of the hardest real-world sampling problems. The population is not just "voters"; it is voters across states, constituencies, caste groups, genders, age groups, rural-urban segments and turnout conditions. In India, this complexity is amplified by multi-phase elections and strong regional party dynamics.
In the 2024 Lok Sabha election, several exit polls, including highly visible projections by polling agencies, overestimated the final performance of the ruling alliance compared with the actual count. Axis My India became a widely discussed example because it is known for large-scale field polling and granular coverage, yet the final result exposed the limits of sample size alone.
The primary lesson is not that polling is useless. The primary lesson is that representativeness beats raw n. The supporting drivers are equally important: booth selection, demographic weighting, regional modelling, respondent willingness to disclose preference, late swing, turnout variation and the conversion of vote share into seats. If any of these are off, the estimate can look statistically precise but still miss the population reality.
The strategic "so what": in analytics, never defend a result only by saying "the sample was huge." A strong answer explains sample design, bias checks, weighting and uncertainty together.
How AI Changes Sampling, Sampling Bias & the Central Limit Theorem
AI does not replace statistical thinking; it raises the penalty for weak sampling. In 2026, three changes matter for MBA analytics and business decision-making.
- AI improves adaptive sampling: survey platforms and research teams can use ML to detect under-represented segments in real time and push more responses from those cells.
- AI makes bias auditing faster: models can compare sample composition against CRM, census, transaction or panel benchmarks and flag coverage gaps before analysis.
- AI creates new bias risks: synthetic respondents, bot traffic, duplicated panel profiles and LLM-generated open-ended answers can contaminate samples if validation is weak.
Use NotebookLM or ChatGPT like a sampling auditor. Paste your survey objective, target population, sampling method and questionnaire, then ask: "List possible coverage bias, selection bias, non-response bias, and how I should check each before using CLT or confidence intervals."
Interview Relevance
"A company surveys 500 app users and finds that customer satisfaction has improved. How would you check whether this conclusion is reliable? Also explain where the Central Limit Theorem fits in."
A strong analytics answer separates two questions: "Is the sample representative?" and "How much random error remains?" Bias answers the first; CLT helps answer the second.
Common Mistake
The mistake: saying "the sample is large, so it is reliable." This costs candidates because CLT only reduces random sampling error - it does not repair a biased sample. One-line fix: "Large n helps precision only after I am comfortable that the sample is representative."
What to Revise Next
Once sampling and CLT are clear, move to the two tools that use them directly: confidence intervals and hypothesis testing. That is the natural journey from "what did my sample show?" to "how confident am I?" to "is the effect statistically meaningful?"