
Where Data Comes From: Answer Events, Transactions, Surveys and Third-Party Sources With Confidence
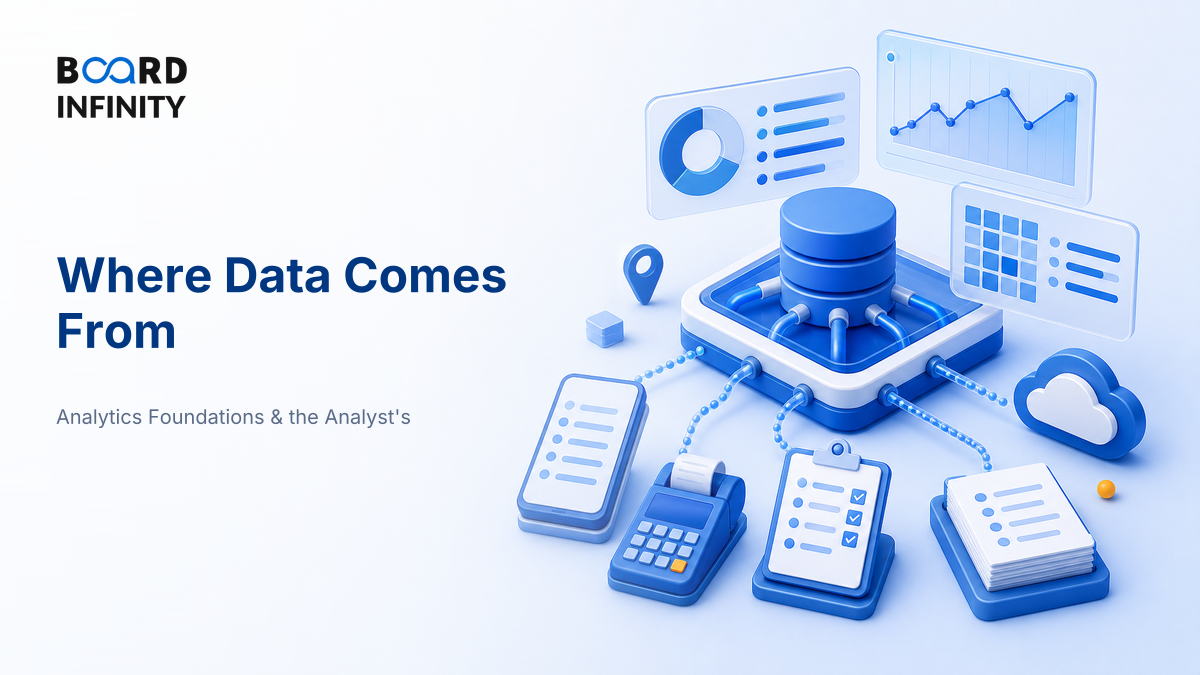
The biggest misconception is that “data” begins when someone downloads a CSV. In reality, it starts much earlier - when a user searches for a movie, a payment succeeds, a customer rates an experience, or an external partner shares a feed.
- Events capture actions over time - clicks, app opens, searches, scans, page views, delivery status changes.
- Transactions capture completed business exchanges - orders, invoices, payments, refunds, subscriptions, shipments.
- Surveys capture stated opinions or facts - NPS, satisfaction, brand recall, employee engagement, product feedback.
- Third-party sources are external data feeds - government data, credit bureau data, maps, weather, market reports, partner APIs.
- The key interview phrase is data generating process: ask who created the data, why, how, when, and what got excluded.
- Good analysis matches the source to the decision: events for behaviour, transactions for value, surveys for “why”, third-party data for context.
- Never trust a dataset only because it is large - judge it on coverage, completeness, freshness, accuracy, consent and bias.
Think of data sources as four doors into the same business reality. Each door sees a different truth: what people do, what they buy, what they say, and what the outside world adds as context.
The Core Idea: Data Is a Trace of a Process
Every dataset is a trace left behind by a process. A retail bill is a trace of a purchase process. A page view is a trace of a digital journey. A survey response is a trace of a question-answer interaction. A credit score is a trace of an external institution’s model.
That is why the same customer can look different across sources. In event data, she is “searched for running shoes three times.” In transaction data, she is “bought once at ₹2,499.” In survey data, she is “price-sensitive.” In third-party data, she may be “lives in a high-demand pin code.” The analyst’s job is to combine these views without confusing one for another.
The Four Main Data Sources
If an Indian quick-commerce company asks, “Why are some pin codes converting better?”, events show search and cart behaviour, transactions show paid orders and refunds, surveys reveal delivery pain points, and third-party data adds rain, traffic or local demographics. The strategic so what: better decisions come from source triangulation, not from one dashboard alone.
Events vs Transactions: The Difference Candidates Often Blur
Events are behavioural breadcrumbs. They record actions whether or not money changes hands. Transactions are commercial records. They record exchanges that the business usually reconciles, audits and reports.
For example, 10,000 product views may generate 800 add-to-carts and 240 purchases. The first two are events; the purchase is a transaction. If you mix them carelessly, you may call “interest” as “sales” or miss why a funnel is leaking.
The Data Source Loop: From Instrumentation to Better Decisions
Data is not a one-time extraction. Good organisations run a loop: define the decision, instrument the source, collect data, validate quality, analyse, act, and improve the source design.
Definitions You Should Be Able to Say in One Breath
- Event data: Time-stamped records of actions performed by a user, system, device or process.
- Transaction data: Records of completed business exchanges involving value, obligation, payment, delivery or ownership transfer.
- Survey data: Data collected by asking respondents structured or semi-structured questions.
- Third-party data: Data obtained from an external organisation rather than generated directly by the firm.
- Data provenance: The documented origin, ownership, transformations and permissions attached to a dataset.
- Data generating process: The real-world mechanism that creates, records and filters the observed data.
How to Evaluate a Data Source: 6 Practical Checks
Before analysing any dataset, score the source. This protects you from the classic MBA mistake: building a beautiful model on a dataset that should never have been trusted.
Worked example: Suppose a retailer wants to analyse loyalty members from 10,000 expected monthly transactions. The system captures 9,200 records, 8,740 have customer ID, and 8,100 join correctly to the CRM.
- Coverage rate = 9,200 / 10,000 = 92% - strong enough for broad sales analysis.
- Customer ID completeness = 8,740 / 9,200 = 95% - strong for loyalty analytics.
- CRM match rate = 8,100 / 8,740 = 92.7% - strong for first-party matching.
The conclusion is not “the data is perfect.” The conclusion is: it is usable for loyalty analysis, but the 800 missing transactions may still matter if they are concentrated in one store, channel or payment mode.
Source Choice: Match the Source to the Question
A clean answer always starts with the business question. Then choose the source that best sees that part of reality.
BookMyShow Case Study: Combining Signals Around Live Entertainment
BookMyShow shows how an Indian platform can combine events, transactions, surveys and partner data to understand entertainment demand across movies, sports and live events.

Situation: Entertainment demand in India is highly local and time-sensitive. A movie opening weekend, a cricket match, a comedy show and a music concert do not behave like a steady FMCG product. Demand depends on city, venue, seat availability, show timing, language, artist popularity, payment success and even weekend planning behaviour.
The move: A platform like BookMyShow can use event data from searches, wishlists, page views and seat-map interactions; transaction data from bookings, cancellations, refunds and payment confirmations; survey or rating data from post-event feedback; and third-party or partner data from venues, organisers, movie metadata, maps and calendars. The primary driver is the platform’s first-party demand signal - millions of intent-rich user actions around specific shows and locations. Supporting drivers include partner integrations with cinemas and event organisers, reliable transaction records, recommendation logic, and local context such as city and venue constraints.
Outcome or lesson: The value is not just “more data.” The value is source complementarity. Events reveal interest before purchase, transactions reveal monetised demand, surveys reveal experience quality, and partner or external data explains constraints. That combination supports better recommendations, show discovery, seat inventory decisions and partner insights without pretending that any one source tells the full story.
The strategic so what: a strong data strategy is rarely about one magical dataset. It is about combining sources that observe different parts of the customer journey, while respecting consent, licensing and operational accuracy.
How AI Changes Where Data Comes From
AI is changing the source layer itself, not just the analysis layer. Three shifts matter for 2026 interviews:
- AI-assisted instrumentation: Product and analytics teams can use AI to propose event names, event properties and tracking plans from user journeys. The human still owns the logic, but AI reduces missed events and inconsistent naming.
- Unstructured data becomes usable: Call transcripts, reviews, support chats, sales notes and PDFs can be converted into structured fields using language models. The risk is hallucination, so outputs need validation rules and human review for high-stakes use.
- Data quality monitoring gets smarter: ML systems can flag sudden changes in volume, missing values, duplicate spikes, abnormal latencies or schema breaks before dashboards mislead managers.
Use NotebookLM or ChatGPT like a data-source coach: paste a company description, product journey and annual-report excerpt, then ask, “List likely event, transaction, survey and third-party data sources; for each, state the decision it supports, quality risks and privacy concerns.” This prepares you to speak like an analyst, not just define terms.
Interview Relevance
“Suppose an e-commerce company wants to understand why repeat purchases are falling. What data would you collect, and from where?”
Use this sentence in interviews: “I would first understand the data generating process, because a large dataset can still be biased if it captures only successful transactions or only vocal survey respondents.”
Common Mistake
The mistake: treating every dataset as equally reliable just because it has many rows. This costs candidates because it shows they can run analysis but cannot judge whether the analysis should be trusted. One-line fix: always ask, “How was this data generated, who is missing, and what decision can this source validly support?”
What to Revise Next
Now move from “where data comes from” to “what kind of data it is” and “how to make it usable.” Revise Data Types & Measurement Scales, and Why They Decide Your Test next, because the source determines the variable and the variable determines the method. Then revise Data Cleaning Fundamentals: Missing Values, Outliers & Duplicates, because even the right source needs cleaning before analysis.