
Advanced Excel Techniques for Analytics
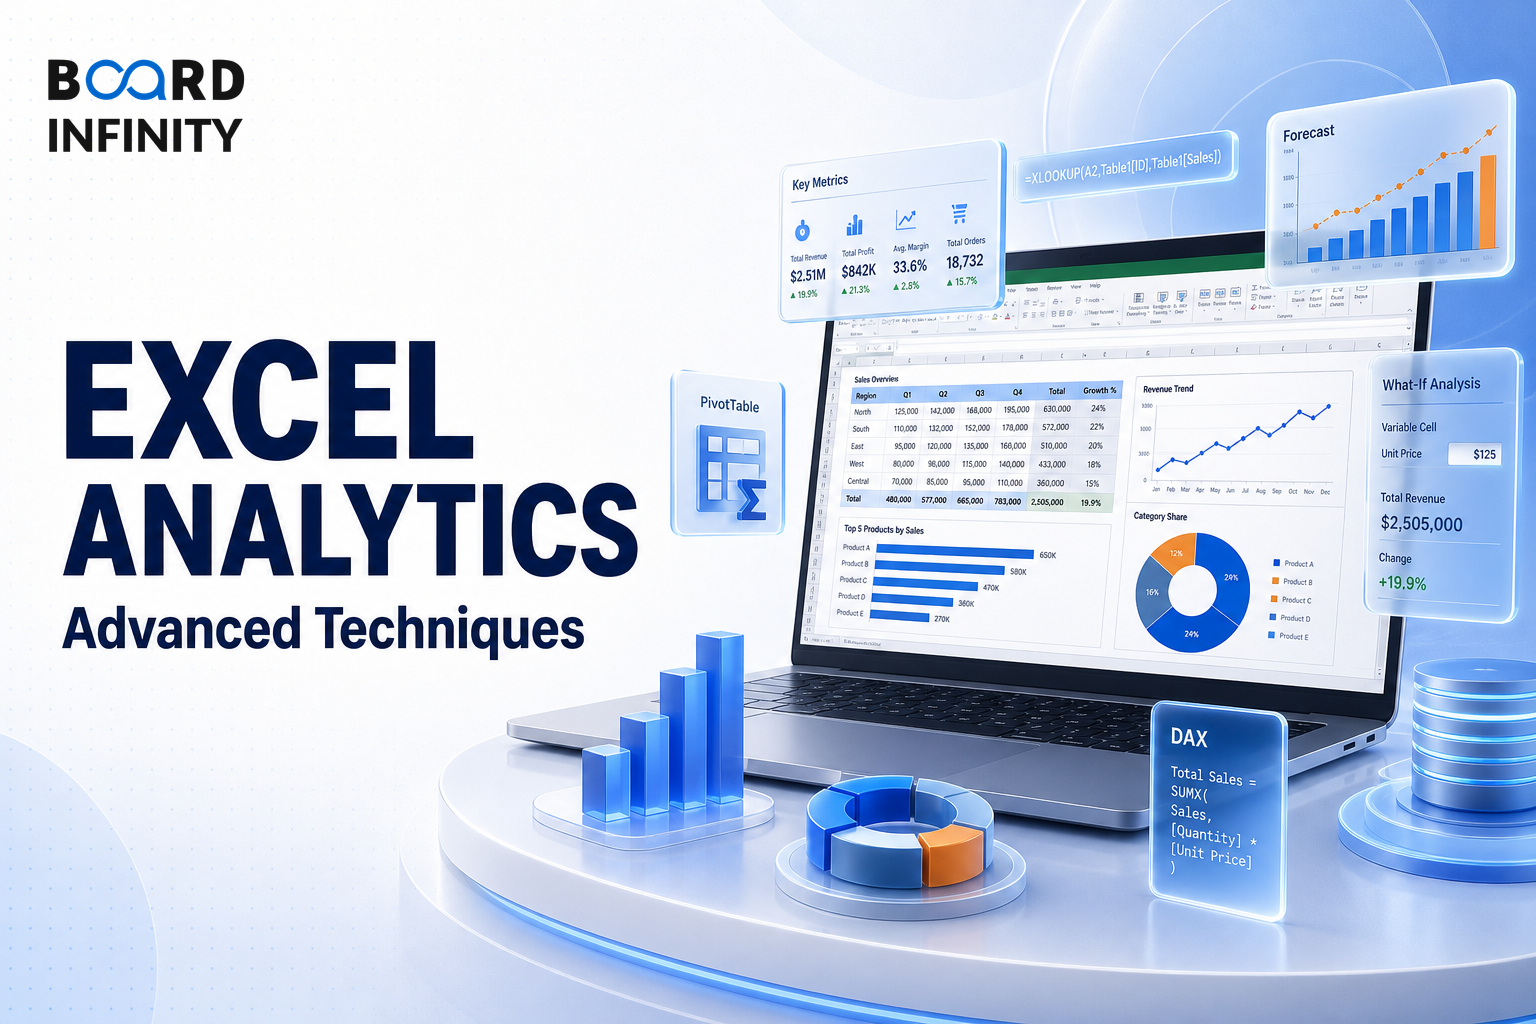
Pivot Tables & Power Query help analysts summarise and refresh business data, but advanced Excel answers a sharper question: which technique should you use when the business needs a decision. In interviews, this matters because the same spreadsheet can be used for sensitivity analysis, break-even targeting, scenario comparison, optimisation, and scalable analytics depending on the problem.
- Data Tables (1-var & 2-var) are used for sensitivity analysis - how one output changes with one or two inputs.
- Goal Seek is used to work backwards - what input gives you a target output.
- Scenario Manager compares 3-4 named scenarios such as Best/Likely/Worst case.
- Solver is used for optimisation with constraints - maximise/minimise an objective.
- SORT/FILTER (Dynamic Arrays) create live, automatically updating filtered and sorted lists.
- Power Pivot & DAX handle an in-memory data model, 10M+ rows, and advanced calculations.
- In the break-even example, ₹15 lakh/month fixed costs, ₹250 variable cost per unit, and ₹650 selling price lead to 3,750 units/month and ~₹24.4 lakh revenue.
The Big Picture: Match the Tool to the Decision
Advanced Excel techniques are best understood as a decision-making toolkit. The choice depends on whether the analyst needs to test input sensitivity, find a target input, compare named cases, optimise under constraints, build live lists, model large data, or calculate without helper columns.
Contribution Margin per Unit: ₹650 - ₹250 = ₹400. Break-Even Units: ₹15,00,000 / ₹400 = 3,750 units/month. Break-Even Revenue: 3,750 × ₹650 = ₹24,37,500/month (~₹24.4 lakh).
D2C Skincare Brand: Break-Even Analysis in Excel
A D2C skincare brand, e.g., Minimalist-style, is planning a new product line. This example shows how Excel can move from model inputs to break-even output, and then use Goal Seek to automate the target calculation.
The key learning is to connect the technique to the decision: Goal Seek is the right choice when the analyst needs to work backwards from a target output to the input that produces it.
How Each Technique Fits Business Decisions
Data Tables (1-var & 2-var) support sensitivity analysis - how one output changes with one or two inputs. The business application is direct: how does profit change across 5 price points?
Goal Seek is used to work backwards - what input gives you a target output. In the break-even example, the analyst sets the Profit cell to 0 and asks Excel to find the Units Sold value.
Scenario Manager compares 3-4 named scenarios such as Best/Likely/Worst case. A business application is fundraising scenarios for a D2C startup.
Solver handles optimisation with constraints - maximise/minimise an objective. The business application is to optimise ad budget allocation across 6 channels with ₹ constraints.
SORT/FILTER (Dynamic Arrays) create live, automatically updating filtered and sorted lists. A practical application is top 10 customers by revenue, updated daily.
Power Pivot & DAX support an in-memory data model, handle 10M+ rows, and advanced calculations. The business application is to combine 3 data tables and calculate running LTV without VLOOKUP.
Array Formulas (CTRL+SHIFT+ENTER) support multi-condition calculations without helper columns. A business application is SUMPRODUCT for weighted average NPS across regions.
Structuring an Advanced Excel Techniques for Analytics Interview Answer
"How would you choose the right advanced Excel technique for sensitivity analysis, break-even targeting, scenario comparison, optimisation, and scalable analytics?"
The strongest answers do not just name an advanced Excel feature. They tie the feature to when to use it, its complexity, and the business application it supports.
The most frequent error is treating advanced Excel techniques as interchangeable. Data Tables, Goal Seek, Scenario Manager, Solver, Dynamic Arrays, Power Pivot & DAX, and Array Formulas solve different business problems, so choosing the wrong tool weakens the decision logic and costs interview points.
Conclusion
Advanced Excel is most powerful when each technique is matched to the decision it supports: sensitivity analysis, break-even targeting, scenario comparison, optimisation, or scalable analytics. In interviews, the final takeaway is simple - explain the business question first, then choose the Excel tool that answers it.