
Excel for Analytics: Beyond the Basics
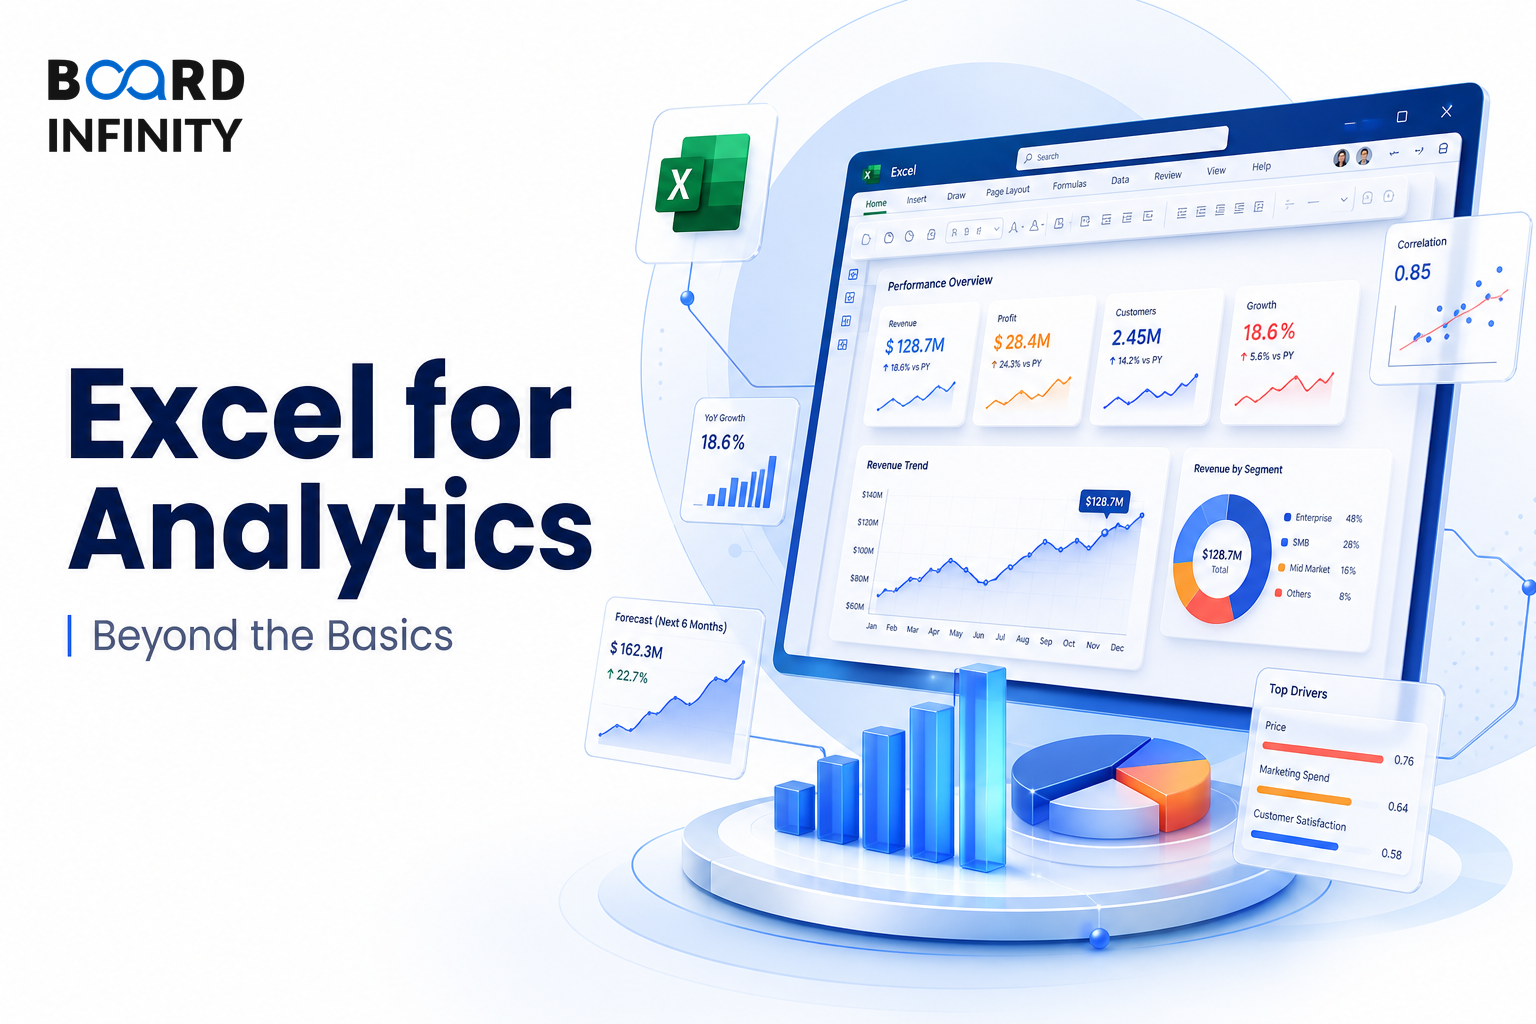
Excel is NOT just for beginners. Advanced analysts use Excel for data joining, filtered summaries, data cleaning, live dynamic reports, in-memory modelling, and optimisation, which is why interviewers treat it as a serious analytics toolkit rather than a basic spreadsheet skill.
- Excel is NOT just for beginners.
- Advanced analysts use Power Query for ETL, Power Pivot for in-memory modelling, dynamic arrays for live calculations, and Solver for optimisation.
- These capabilities handle most business analytics needs below 1M rows.
- Lookup & Reference functions support data joining, cross-table lookup, and dynamic range selection.
- Conditional Aggregation functions support filtered summaries, KPI calculations, and segment analysis.
- INDEX-MATCH looks in any direction, is immune to column insertions, and is faster.
- Power Query steps are recorded, repeatable, and refresh automatically when new data arrives.
Big Picture: Excel as an Analytics Toolkit
Advanced Excel analytics combines functions, repeatable ETL, in-memory modelling, live calculations, and optimisation. Below the 1M-row threshold, these capabilities handle most business analytics needs.
Power Functions and Analytics Use Cases
The core of advanced Excel is knowing which category of functions maps to which analytics use case. The table below connects each category to its key functions, business use case, and India-specific example.
Lookup Strategy: INDEX-MATCH vs VLOOKUP
VLOOKUP Limitations: Can only look left-to-right; column index number breaks when columns are inserted; slower on large datasets.
=INDEX(return_range, MATCH(lookup_value, lookup_range, 0)) - looks in any direction, immune to column insertions, faster.
=XLOOKUP(lookup, lookup_array, return_array) - best of both worlds, returns error message if not found (no need for IFERROR).
Power Query for Repeatable ETL
Power Query is used for ETL through a repeatable flow: Connect, Transform, Load, and Refresh. It is especially useful when analysts need to consolidate and clean recurring files instead of manually editing Excel cells.
Never manually clean data in Excel cells - always use Power Query steps. Steps are recorded, repeatable, and refresh automatically when new data arrives.
Indian Context: FMCG companies (HUL, Nestlé, ITC) use Power Query extensively to consolidate monthly distributor sales reports from 50+ Excel files into a single dashboard.
Power Pivot, Dynamic Arrays, and Solver
Advanced analysts use Power Pivot for in-memory modelling, dynamic arrays for live calculations, and Solver for optimisation. These capabilities move Excel beyond one-off formulas into structured analytics work.
Worked Example: Goal Seek for Break-Even Analysis
Goal Seek is used to work backwards - what input gives you a target output?
Break-Even Units: ₹15,00,000 / ₹400 = 3,750 units/month
Break-Even Revenue: 3,750 × ₹650 = ₹24,37,500/month (~₹24.4 lakh)
With Goal Seek: Analyst sets the Profit cell to 0, asks Excel to find the Units Sold value - automated break-even in seconds.
Where Excel Fits in Tool Selection
For data size, Excel is practical below 1M rows. The expectation is: Excel for quick answers, SQL for data extraction, Python for heavy analysis, BI tool for communication.
Reality Check - Tool Maturity in India: In 2025, most Indian corporate analytics teams still do 60-70% of their work in Excel. SQL is used by ~50% of analysts. Python usage is growing but is still a differentiator at fresher level.
The most frequent error is treating Excel as manual cell-by-cell work instead of using repeatable tools such as Power Query steps. Manual cleaning is hard to repeat, hard to refresh, and weaker for analytics workflows where new data arrives regularly.
Conclusion
Excel remains a serious analytics toolkit when used with advanced functions, Power Query, Power Pivot, dynamic arrays, and Solver. The key takeaway is to use Excel for quick answers and structured business analytics needs below 1M rows, not just basic spreadsheet tasks.