
Analytics Career Ladder: What Each Level Owns in Interviews
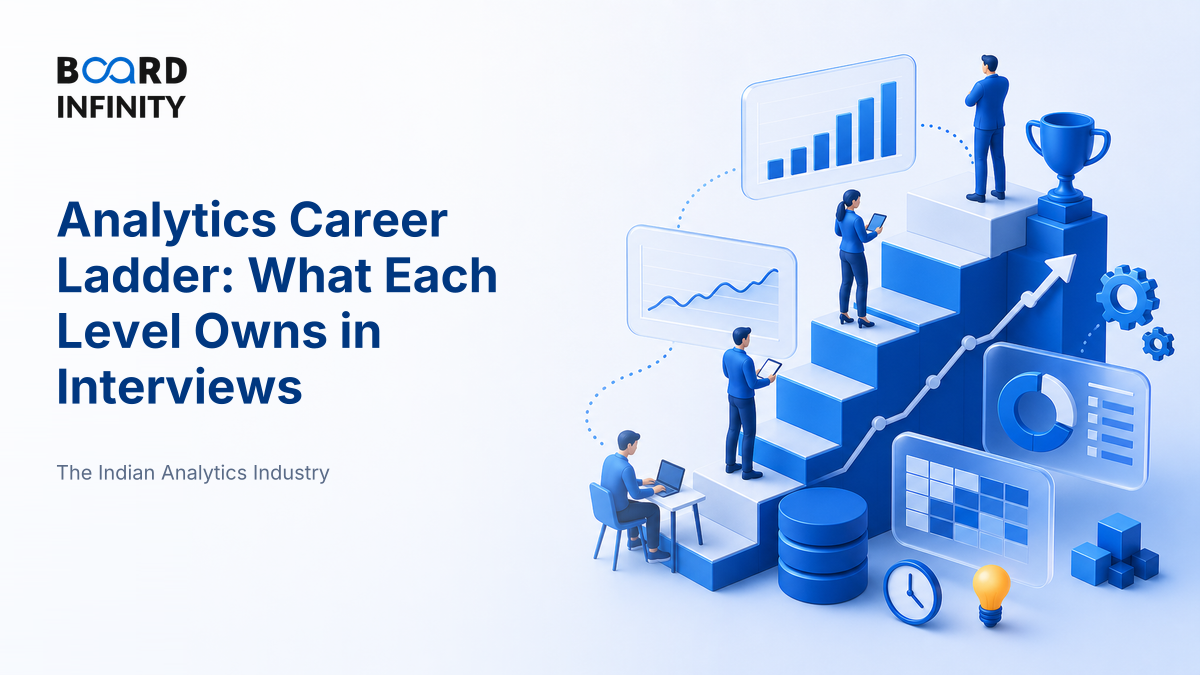
A growth dashboard turns red at 11:07 a.m.: conversions are down, refunds are rising, and the campaign team wants an answer before the next push notification goes out. The junior analyst can find the broken metric; the senior analyst can explain why it moved; the analytics leader decides what the business should do next. That is the analytics career ladder - not a title ladder, but an ownership ladder.
- The analytics ladder measures ownership, not tool count. As you grow, you move from answering requests to owning decisions.
- Junior analysts own accuracy and clarity: clean data, correct dashboards, basic SQL, and crisp business readouts.
- Senior analysts own diagnosis: metric trees, root-cause analysis, segmentation, experimentation basics, and stakeholder recommendations.
- Leads and managers own portfolios: prioritization, project design, stakeholder trade-offs, analyst coaching, and measurable business impact.
- Principal and director levels own systems: analytics standards, decision governance, cross-functional data strategy, and organization-level outcomes.
- The biggest interview signal is decision maturity: show how your analysis changed an action, not just what tool you used.
Big Picture: The Ladder Is a Shift from Answers to Decisions
Analytics careers widen along four axes: ambiguity handled, business impact owned, stakeholder complexity managed, and decision rights earned. Early levels ask, “What happened?” Senior levels ask, “What should the business do, and how will we know it worked?”
Core Explanation: What Each Analytics Level Actually Owns
Ownership means being accountable for the quality of a decision, not merely producing a file, dashboard, or model. Titles vary by company, but the ladder below is the mental model interviewers use when judging whether you understand analytics careers.
The ladder has two tracks after the senior stage. The manager track scales impact through people, roadmaps, and stakeholder governance. The principal or staff track scales impact through expertise, methods, reusable systems, and influence without directly managing a large team.
The Five Ownership Dimensions Interviewers Listen For
When a company says “2 years of analytics experience” or “analytics manager,” decode it through these five ownership dimensions.
How Analytics Ownership Is Measured
Analytics teams should not be judged only by number of dashboards or models shipped. A stronger scorecard connects analysis to decision quality, speed, trust, and business action. Use the ranges below as internal operating ranges, not universal industry benchmarks.
Mini worked example: suppose an analytics team makes 20 decision-ready recommendations in a quarter and 14 are implemented. Decision adoption rate = 14 / 20 = 70%. If only 5 were implemented because the analysis was unclear and 9 were rejected for business constraints, the improvement area is not just analysis quality - it is earlier stakeholder alignment.
Definitions You Can Say in One Breath
Davenport and Harris: “Analytics is the extensive use of data, statistical and quantitative analysis, explanatory and predictive models, and fact-based management to drive decisions and actions.”
Descriptive analytics explains what happened. Diagnostic analytics explains why it happened. Predictive analytics estimates what may happen. Prescriptive analytics recommends what action to take.
Career ladder in analytics means the progression of accountability from producing correct analysis to owning repeatable business decision systems.
Case Study: Meesho and the Analytics Ladder in a Marketplace
Meesho shows why analytics ownership matters in a two-sided Indian marketplace where growth, trust, price sensitivity, logistics, and seller quality must be balanced together.
Meesho operates in a market where many buyers are value-conscious, many sellers are small or regional, and transaction trust is shaped by catalog quality, delivery reliability, returns, payments, and customer support. A dashboard alone cannot solve that system. The business needs analytics at multiple levels of ownership.

The primary driver of analytics value in a marketplace like Meesho is closing the loop between buyer behaviour and seller-side actions at a granular level - category, pin code, price band, delivery promise, and return pattern. Supporting drivers include mobile-first product design, seller onboarding, logistics partnerships, payment options common in India, and disciplined experimentation.
The lesson is simple: junior analytics improves visibility, senior analytics improves diagnosis, and leadership-level analytics improves the operating system of decisions. In marketplace businesses, shallow analytics says “returns are up.” Mature analytics asks “which seller-category-pin-code combinations are damaging trust, what intervention should we test, and what guardrail protects growth?”
How AI Changes the Analytics Career Ladder
AI does not remove the ladder; it compresses the lower rungs and raises the bar for judgment. By 2026, interviewers increasingly expect analytics candidates to know where AI helps and where it can mislead.
- Natural-language BI reduces basic query work. Tools can generate SQL, charts, and first-pass summaries from plain English. Analysts must therefore own metric definitions, data quality, and interpretation more strongly because a polished AI-generated chart can still be wrong.
- AutoML and copilots move value toward problem framing. Forecasting, clustering, and model prototyping are faster, but choosing the right target variable, avoiding leakage, designing holdouts, and explaining trade-offs remain human ownership tasks.
- LLM products create new analytics ownership. Teams now track prompt performance, hallucination risk, retrieval quality, human feedback, and privacy controls. In India, analytics teams must also be mindful of customer data handling under the Digital Personal Data Protection Act framework.
Load the job description, company annual report or investor presentation, and this lesson into NotebookLM. Ask: “Map this analytics role to the ladder, list likely interview questions, and identify which business metrics this company probably cares about.” Then verify every claim from the original documents before using it.
Interview Relevance
“Suppose you join as a business analyst in our growth team. How would your responsibilities differ from a senior analyst or analytics manager?”
If you are a fresher, do not pretend to be an analytics manager. Instead say: “I am entering at the analyst rung, but I understand that the path is to move from correct analysis to decision ownership.” That answer sounds mature and credible.
Common Mistake
The mistake: explaining the analytics ladder as “junior knows Excel, senior knows SQL, manager knows Python.” This costs candidates because it reduces analytics to tools and misses the business ownership interviewers are testing. One-line fix: always explain each level by the decision it owns, the ambiguity it handles, and the impact it is accountable for.
What to Revise Next
Now that you understand how ownership changes by level, revise the role map and the compensation map. First study Twelve Analytics Roles Explained, With the Skills Each Screens For to separate product analyst, business analyst, data scientist, analytics engineer, and BI roles. Then revise Compensation by Level and Employer Type so you can read offers realistically across startups, GCCs, consulting firms, banks, and product companies.