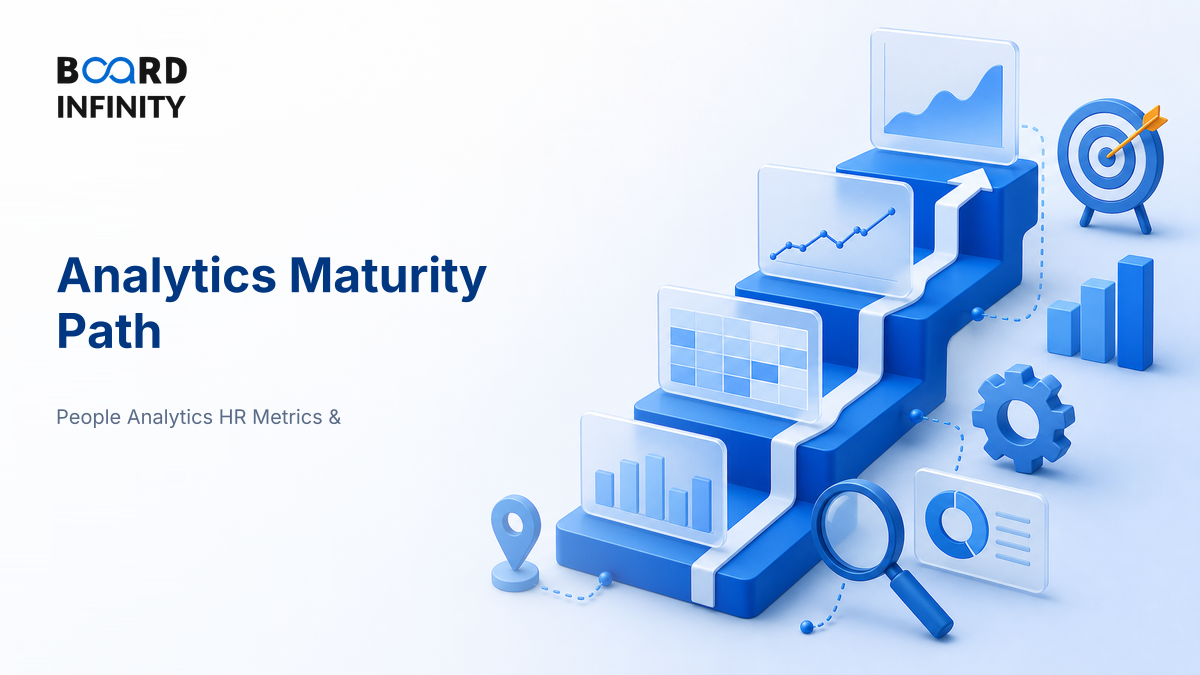
The biggest misconception about analytics maturity is that it means “more dashboards.” Walk into many companies and you will see beautiful charts refreshed every morning - yet pricing, hiring, inventory and retention decisions are still made by instinct.
Analytics maturity is the journey from knowing what happened to deciding what to do next.
The path usually moves from reporting to diagnosis to prediction to prescription.
Reporting answers “What happened?”; prediction answers “What is likely to happen?”
A mature analytics system needs clean data, business adoption, model quality, and decision integration - not just tools.
The real test is whether analytics changes decisions: pricing, staffing, credit approval, inventory, retention or routing.
Prediction is useful only when paired with action - a churn model without a retention playbook is just expensive reporting.
In interviews, explain maturity as a ladder plus feedback loop: data creates insight, insight drives action, action creates new data.
Big Picture: The Ladder from Looking Back to Looking Ahead
Analytics maturity is best understood as a decision ladder. At the bottom, the organization reports past performance. At the top, it uses data to predict future outcomes and recommend actions before the problem fully appears.
Analytics maturity rises when the organization moves from hindsight to foresight and action.]
<h2>Core Explanation: What Changes at Each Stage</h2>
<p>The analytics maturity path is not mainly a technology upgrade. It is a shift in how decisions are made. The question moves from “Can we see the data?” to “Can we trust it, explain it, predict with it, and act on it?”</p>
<data-table
data-headers='["Maturity stage", "Question answered", "Typical output", "Business example"]'
data-rows='[
["Reporting", "What happened?", "Dashboards, MIS reports, KPI trackers", "Monthly attrition report by department"],
["Diagnostic analytics", "Why did it happen?", "Root-cause analysis, cohorts, drill-downs", "Attrition is higher among first-year sales employees in two regions"],
["Predictive analytics", "What is likely to happen?", "Forecasts, risk scores, propensity models", "Employees with low engagement and long commute are at higher exit risk"],
["Prescriptive analytics", "What should we do?", "Recommendations, optimization, next-best actions", "Offer manager coaching, role change or retention intervention to specific employee groups"]
]'>
</data-table>
<p>The maturity jump is visible in the <strong>unit of action</strong>. Reporting usually works at aggregate level - branch, region, month, department. Prediction works at decision level - customer, SKU, employee, loan application, shipment, route or campaign.</p>
<h2>The Operating Loop: Mature Analytics Learns from Decisions</h2>
<p>A common mistake is to treat analytics as a one-time project: build dashboard, present insight, close file. Mature analytics behaves like a learning loop. Every action creates new outcome data, and that outcome improves the next model or decision rule.</p>
[[FIGURE: {"layout":"cycle","items":[{"label":"Data","note":"Events captured"},{"label":"Insight","note":"Patterns found"},{"label":"Decision","note":"Action taken"},{"label":"Outcome","note":"Impact measured"},{"label":"Learning","note":"Model improved"}]} | caption: Analytics maturity compounds when every decision feeds the next cycle of learning.]
<p>For example, a bank’s credit model is not mature merely because it predicts default risk. It becomes mature when the bank records which applications were approved, which customers defaulted, which segments were wrongly rejected, and how those outcomes improve future underwriting.</p>
<tip-box data-type="info" data-title="Example - Indian Credit Analytics" data-icon="📌">
<p>Indian lenders such as Bajaj Finance and large private banks use analytics across customer segmentation, credit assessment, collections prioritization and cross-sell targeting. The strategic point is not “they use data”; it is that analytics is embedded into repeatable business decisions where risk, speed and personalization matter together.</p>
</tip-box>
<h2>Definitions You Can Say in One Breath</h2>
<tip-box data-type="info" data-title="Core Definitions" data-icon="📘">
<ul>
<li><strong>Descriptive analytics:</strong> Summarizes historical data to show what happened.</li>
<li><strong>Diagnostic analytics:</strong> Explains why an outcome happened by examining patterns, drivers and relationships.</li>
<li><strong>Predictive analytics:</strong> Uses data and models to estimate likely future outcomes.</li>
<li><strong>Prescriptive analytics:</strong> Recommends actions by combining predictions, constraints and business objectives.</li>
<li><strong>Analytics maturity:</strong> An organization’s capability to convert data into trusted, repeatable and decision-changing action.</li>
</ul>
</tip-box>
<h2>Reporting vs Prediction: The Interview-Critical Difference</h2>
<p>The cleanest distinction is this: <strong>reporting describes an outcome after it happens; prediction estimates the outcome before it happens.</strong> Reporting is still valuable, but prediction becomes powerful when time-to-act matters.</p>
[[FIGURE: {"layout":"compare","items":[{"label":"Reporting","note":"Past, aggregate, descriptive"},{"label":"Prediction","note":"Future, granular, probabilistic"}]} | caption: Reporting improves visibility; prediction improves preparedness.]
<data-table
data-headers='["Dimension", "Reporting", "Prediction"]'
data-rows='[
["Time orientation", "Past or current period", "Future event or probability"],
["Typical question", "What happened last month?", "Who is likely to churn next month?"],
["Output", "Dashboard, table, trend, variance", "Score, forecast, probability, ranking"],
["Decision style", "Review and react", "Prioritize and intervene early"],
["Risk", "Too slow for fast-moving problems", "May be inaccurate or biased if data is weak"]
]'>
</data-table>
<h2>How to Measure Analytics Maturity</h2>
<p>Maturity must be measured through adoption, data reliability, model performance and business impact. A technically impressive model that nobody uses is not mature analytics.</p>
<data-table
data-headers='["Metric", "Formula or definition", "What strong looks like"]'
data-rows='[
["Dashboard adoption rate", "Active business users / intended users x 100", "Range is 0-100%; above 70% is strong if users are decision-makers, not passive viewers"],
["Data freshness SLA", "Reports refreshed on time / reports due x 100", "Range is 0-100%; above 95% is strong for operational dashboards"],
["Decision latency", "Time between business event and decision taken", "Range depends on process; lower is stronger, especially for fraud, pricing, inventory and service recovery"],
["Forecast accuracy", "MAPE = average absolute percentage error between actual and forecast", "Range starts at 0%; lower is stronger, with acceptable levels varying by demand volatility"],
["Model lift", "Target rate in scored group / average target rate in population", "Range is 1x and above; above 2x is strong for many targeting use cases"],
["Action rate", "Recommendations acted upon / recommendations generated x 100", "Range is 0-100%; above 60% suggests analytics is embedded in workflow"]
]'>
</data-table>
<h2>Worked Example: From Churn Report to Churn Prediction</h2>
<p>Suppose a subscription business has 10,000 customers. Last month, 1,000 customers churned, so the baseline churn rate is 10%.</p>
<p>A predictive model ranks customers by churn risk. The company targets the top 2,000 high-risk customers. Later, it finds that 500 of the 1,000 actual churners were in this targeted group.</p>
<data-table
data-headers='["Measure", "Calculation", "Interpretation"]'
data-rows='[
["Baseline churn rate", "1,000 / 10,000 = 10%", "A random customer has 10% churn risk"],
["Targeted group precision", "500 / 2,000 = 25%", "One in four targeted customers actually churned"],
["Capture rate", "500 / 1,000 = 50%", "The model found half of all churners in 20% of customers"],
["Lift", "25% / 10% = 2.5x", "The model is 2.5 times better than random targeting"]
]'>
</data-table>
<p>This is the maturity shift. The old report says, “1,000 customers churned.” The predictive system says, “These 2,000 customers need attention now.”</p>
<h2>Case Study: Zepto’s Analytics Maturity in Quick Commerce</h2>
<tip-box data-type="info" data-title="Case Study - Zepto" data-icon="🏆"><p>Zepto shows how analytics maturity works when prediction is tied directly to inventory, dark-store operations and delivery promises.</p></tip-box>
[[GOLD-IMAGE: A night-time Indian quick-commerce dark store with purple-lit shelves, packed grocery totes, and a delivery rider waiting near a phone screen with a generic order map, no logos or readable text | caption: Quick commerce makes analytics visible because every wrong forecast becomes an empty shelf, delayed order or wasted inventory.
Situation: Quick commerce is a difficult analytics problem because demand is hyperlocal and volatile. A customer in Bandra, Bengaluru or Gurugram may expect snacks, milk, ice cream, diapers or phone chargers within minutes. Festival days, rain, cricket matches, salary cycles and local consumption patterns can all change demand quickly.
The move: Zepto’s business model depends on moving beyond simple sales reporting. Reporting can show yesterday’s stock-outs and order volumes, but that is too late. The more mature analytics problem is predicting SKU-level demand by dark store, time band and micro-market, then linking it to replenishment, assortment, picking capacity and rider availability.
Outcome or lesson: The primary driver is predictive demand planning at micro-market level. Supporting drivers include dense dark-store placement, app-level behavioral data, standardized fulfilment processes, supplier coordination and real-time operational monitoring. The lesson is clear: prediction creates value only when the operating model can act on it fast.
[[FIGURE: {"layout":"hub","centre":{"label":"Fast Fulfilment"},"items":[{"label":"Demand Forecast","note":"SKU by store"},{"label":"Inventory Plan","note":"Right stock"},{"label":"Picker Capacity","note":"Order speed"},{"label":"Rider Allocation","note":"Delivery reliability"}]} | caption: In quick commerce, predictive analytics works only when forecasting connects to operations.]
How AI Changes Analytics Maturity Path from Reporting to Prediction
AI is compressing the maturity journey. Earlier, a company needed separate teams for SQL reporting, statistical modeling, visualization and business translation. In 2026, AI tools make some of that work faster - but they also make governance more important.
Natural-language BI: Business users can ask questions like “Which region’s attrition worsened after manager changes?” and receive a chart or SQL-generated answer. This reduces dependence on static dashboards, but only if the semantic layer and data definitions are clean.
AutoML and feature discovery: Tools can test multiple models, identify predictive variables and compare performance faster. The risk is blind model selection without business logic, bias checks or explainability.
AI-generated insight narratives: LLMs can summarize dashboard movements, highlight anomalies and draft executive commentary. This helps reporting become diagnostic, but humans must verify causality before acting.
Use NotebookLM or Perplexity with a company annual report, investor presentation and recent news. Ask: “Map this company’s decisions to descriptive, diagnostic, predictive and prescriptive analytics. Give interview-style examples and risks.” Then verify every factual claim before using it.
Interview Relevance
“Explain the analytics maturity path from reporting to prediction. If you were the HR analytics manager of a large company, how would you move from attrition reporting to attrition prediction?”
Use the phrase: “The maturity test is not whether the company has a model; it is whether the model changes a decision at the right time.” That line separates strong candidates from dashboard-only answers.
Common Mistake
The biggest mistake is treating prediction as the final stage. It costs candidates because a prediction without an action plan has no business value. The one-line fix: always say what decision the prediction will change, who will act on it, and how the outcome will be measured.
What to Revise Next
Now connect this maturity path to HR analytics, where reporting-to-prediction questions are very common in interviews. Revise the data foundations first, then the formulas that make HR metrics reliable.
Mark Lesson Complete (Analytics Maturity Path: Answer Reporting to Prediction with Confidence)