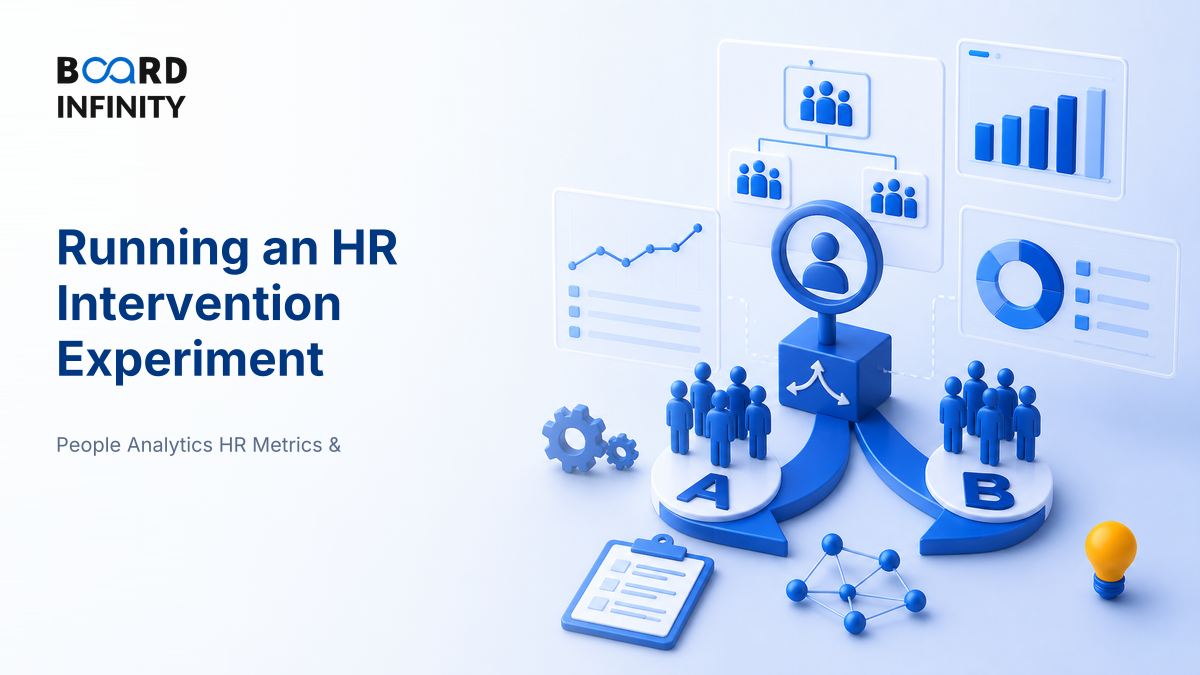
One HR team rolls out manager coaching and proudly reports attrition fell from 18% to 14%. Another runs the same coaching with a matched control group and discovers attrition was falling everywhere because hiring had slowed. The difference is not effort - it is experimental discipline.
An HR experiment tests whether an intervention caused an outcome, not merely whether results improved after launch.
The cleanest design is: hypothesis, treatment group, control group, pre-post measurement, statistical and business interpretation.
Random assignment is the gold standard because it balances visible and invisible employee differences across groups.
Always track both people outcomes and business outcomes - for example attrition, absenteeism, productivity, engagement and ROI.
Do not scale an intervention just because the treatment group improved; compare the change against a control group.
In HR, ethics matter: informed communication, privacy, fairness and no denial of legally required benefits.
The best interview answer ends with a decision rule: scale, modify or stop based on evidence and business value.
Big Picture: An HR Experiment Is a Causality Machine
An HR intervention is any deliberate people practice designed to improve employee or business outcomes - for example coaching, flexible work, onboarding redesign, incentive changes or wellbeing support. The experiment asks one sharp question: did this intervention cause a better outcome than what would have happened anyway?
An experiment earns its value by separating the HR intervention from everything else that changed.]
<h2>Core Explanation: How to Run an Experiment on an HR Intervention</h2>
<p>The big idea is simple: create two comparable worlds. In one world, employees receive the intervention. In the other, they do not receive it yet or receive the current standard practice. If the treatment group improves more than the control group, you have stronger evidence that the intervention worked.</p>
<roadmap-steps
data-steps='[
{"title":"Start with a causal hypothesis","desc":"State the expected cause and effect clearly: manager coaching will reduce 90-day attrition among new sales hires."},
{"title":"Choose the unit of assignment","desc":"Randomise at employee, team, store, branch or cohort level depending on contamination risk and operational practicality."},
{"title":"Create treatment and control groups","desc":"Treatment receives the HR intervention; control continues with current practice or receives the intervention later."},
{"title":"Measure baseline and outcome","desc":"Capture pre-intervention data and post-intervention data using the same definitions across both groups."},
{"title":"Analyse effect and decide","desc":"Compare treatment change with control change, check significance and business value, then scale, modify or stop."}
]'>
</roadmap-steps>
[[FIGURE: {"layout":"flow","items":[{"label":"Hypothesis","note":"What should change?"},{"label":"Assign groups","note":"Treatment vs control"},{"label":"Measure","note":"Before and after"},{"label":"Analyse","note":"Effect and ROI"},{"label":"Decide","note":"Scale or stop"}]} | caption: A strong HR experiment turns a people initiative into a disciplined decision process.]
<p>In interviews, say the design before you say the tool. A survey, dashboard or regression is not the experiment. The experiment is the logic of comparison.</p>
<h2>The Three Design Choices That Matter Most</h2>
<p>Most HR experiments fail because the design is loose. Three choices decide whether your conclusion will be trusted by business leaders.</p>
<h3>1. Randomised, quasi-experimental or simple pilot?</h3>
<p>A <strong>randomised controlled trial</strong> gives the strongest causal evidence because eligible employees or units are assigned randomly. A <strong>quasi-experiment</strong> is used when randomisation is not possible - for example comparing similar branches, shifts or cohorts. A <strong>simple pilot</strong> is useful for feasibility, but weak for causality if there is no control group.</p>
<data-table
data-headers='["Design", "How it works", "When to use", "Causality strength"]'
data-rows='[
["Randomised experiment", "Eligible employees or units are randomly assigned to treatment and control.", "When fairness, operations and ethics allow random allocation.", "Strongest"],
["Quasi-experiment", "Treatment group is compared with a matched or naturally similar group.", "When randomisation is not practical, such as branch-level policy rollout.", "Moderate"],
["Before-after pilot", "One group is measured before and after the intervention.", "When testing feasibility, adoption or operational issues.", "Weak for causality"],
["A/B message test", "Two versions of a communication, nudge or learning prompt are compared.", "When the intervention is low risk and easy to randomise digitally.", "Strong if randomised"]
]'>
</data-table>
<h3>2. Individual randomisation or cluster randomisation?</h3>
<p>If employees in the same team influence one another, individual randomisation can contaminate the experiment. For example, if only half a team gets manager feedback training, trained managers may still change how they behave with everyone. In such cases, randomise at the <strong>team, store, branch or cohort</strong> level.</p>
<h3>3. Statistical significance or business significance?</h3>
<p>A result can be statistically significant but too small to matter. It can also be commercially meaningful but statistically uncertain because the sample is small. A strong HR answer discusses both.</p>
[[FIGURE: {"layout":"hub","centre":{"label":"Causal answer"},"items":[{"label":"Comparable groups","note":"Avoid selection bias"},{"label":"Clean metrics","note":"Same definition"},{"label":"Ethical design","note":"Fair and private"},{"label":"Business value","note":"Worth scaling"}]} | caption: A credible HR experiment needs more than a p-value; it needs comparability, measurement, ethics and business relevance.]
<h2>Metrics to Track in an HR Intervention Experiment</h2>
<p>Use 4-6 measures that connect the intervention to people behaviour and business value. Benchmarks vary by industry, role and labour market, so compare against the control group and pre-agreed business thresholds rather than a universal magic number.</p>
<data-table
data-headers='["Metric", "Formula or definition", "What good looks like"]'
data-rows='[
["Adoption rate", "Employees who actively use the intervention / eligible employees.", "For voluntary HR tools, 60-80% adoption is usually healthy; above 80% is strong if usage is meaningful."],
["Outcome delta", "Post score minus pre score for the target outcome.", "Positive movement is useful only if treatment improves more than control."],
["Difference-in-differences", "(Treatment post - treatment pre) - (Control post - control pre).", "A positive value for desired outcomes, or negative value for attrition and absence, suggests impact."],
["Attrition rate", "Voluntary exits during period / average headcount during period.", "Strong means treatment attrition falls materially more than control attrition."],
["Absenteeism rate", "Absence days / scheduled workdays.", "Strong means lower absence without evidence of presenteeism or gaming."],
["ROI", "(Estimated benefit - intervention cost) / intervention cost.", "ROI above 0 is value creating; above 1 means benefits are more than double the cost."],
["Statistical confidence", "Commonly checked using p-value and confidence interval around the effect.", "p < 0.05 is a common threshold, but practical effect size must still matter."]
]'>
</data-table>
<h2>Worked Example: Testing Manager Coaching to Reduce Early Attrition</h2>
<p>Suppose an Indian B2B sales organisation wants to test whether manager coaching reduces 90-day attrition among new hires. This is a hypothetical example with simple numbers for interview practice.</p>
<data-table
data-headers='["Group", "Employees", "90-day exits", "Attrition rate"]'
data-rows='[
["Treatment: coaching", "200", "18", "18 / 200 = 9%"],
["Control: current practice", "200", "30", "30 / 200 = 15%"]
]'>
</data-table>
<p>The treatment group attrition is 6 percentage points lower than the control group. That is a 40% relative reduction because 6 divided by 15 equals 40%.</p>
<p>If each avoided early exit costs roughly ₹1.5 lakh in replacement, training and lost productivity, the 12 additional retained employees create an estimated benefit of ₹18 lakh. If the coaching programme costs ₹10 lakh, ROI equals (₹18 lakh - ₹10 lakh) / ₹10 lakh = 80%.</p>
<p>The interview-safe conclusion is: “The intervention appears commercially promising, but I would still check whether groups were comparable, whether exits were voluntary, and whether the effect persists beyond 90 days.”</p>
<h2>Definitions You Should Be Able to Say Clearly</h2>
<tip-box data-type="info" data-title="Core Definitions" data-icon="📘">
<ul>
<li><strong>Experiment:</strong> Shadish, Cook and Campbell describe experiments as studies where an intervention is deliberately introduced to observe its effects.</li>
<li><strong>HR intervention:</strong> A deliberate people-practice change designed to improve employee, team or business outcomes.</li>
<li><strong>Treatment group:</strong> Employees or units that receive the intervention being tested.</li>
<li><strong>Control group:</strong> Comparable employees or units that do not receive the intervention during the test period.</li>
<li><strong>Random assignment:</strong> A process that allocates eligible participants to groups by chance, reducing selection bias.</li>
<li><strong>Difference-in-differences:</strong> A method comparing outcome changes over time between treatment and control groups.</li>
</ul>
</tip-box>
<h2>Indian Example: Testing a Scheduling Intervention in a Quick-Commerce Operation</h2>
<p>Imagine a quick-commerce company operating dark stores in Bengaluru, Mumbai and NCR wants to reduce picker absenteeism during high-pressure evening shifts. A weak HR answer says, “Launch a wellbeing programme.” A strong experiment answer says, “Randomise comparable stores into treatment and control, test one scheduling change, and measure absenteeism, order-picking productivity and retention.”</p>
<p>For a Swiggy Instamart or Zepto-like operation, the India-specific mechanics matter: shift predictability, local commute constraints, festival-season demand spikes, gig-versus-payroll worker classification and city-wise labour availability. This is not a claim that any one company ran this exact experiment; it is how to design a credible Indian HR intervention test without pretending a people problem has a one-line solution.</p>
<tip-box data-type="tip" data-title="Strategic So What" data-icon="💡">
<p>The primary driver of success would be reducing schedule uncertainty for workers. Supporting drivers would include store-manager compliance, demand forecasting accuracy, fair overtime rules and a clean way to separate HR impact from festive demand fluctuations.</p>
</tip-box>
<h2>Case Study: Gap and the Stable Scheduling Experiment</h2>
<tip-box data-type="info" data-title="Case Study - Gap" data-icon="🏆">
<p>Gap tested more stable retail schedules in a field experiment, showing how an HR intervention can improve both employee lives and store performance.</p>
</tip-box>
[[GOLD-IMAGE: A calm clothing store stockroom in navy and white tones, with neatly arranged apparel racks and a store associate checking a simple weekly schedule board with no readable text | caption: Stable scheduling turns uncertainty into a manageable work routine.
Retail work often suffers from unpredictable schedules: last-minute shift changes, on-call shifts and inconsistent weekly hours. For employees, that creates childcare, commuting and income stress. For managers, it can look like absenteeism, disengagement and turnover.
Researchers working with Gap tested a stable scheduling intervention across a group of stores. The move was not just “be nicer to employees.” It included operational changes such as more advance notice of schedules, greater shift consistency and reduced reliance on unstable on-call practices. Treatment stores were compared with control stores, which made the study more credible than a simple before-after story.
The case is memorable because it challenges a common assumption: employee-friendly practices are not automatically cost centres. If designed well, an HR intervention can remove friction from the operating system of work. The primary driver was schedule stability; supporting drivers included store-level implementation, workforce planning and the ability to measure outcomes against a control group.
How AI Changes Running an Experiment on an HR Intervention
AI does not replace experimental design. It makes good design faster and bad design more dangerous.
A practical student workflow: load the company’s annual report, HR policy notes and your experiment design into NotebookLM. Ask it to generate likely interview questions such as “How would you prove this intervention caused lower attrition?” and “What ethical issues arise if only some employees receive the benefit?” Then refine your answer using the control-group and metric logic above.
Interview Relevance
“Our employee engagement scores are low. The CHRO wants to launch a manager coaching programme. How would you test whether it actually works?”
Use the phrase “I would separate statistical significance from business significance.” It signals maturity because HR decisions need evidence and judgment.
Common Mistake
The biggest mistake is claiming success from a before-after improvement. Attrition, engagement or productivity may have changed because of seasonality, manager changes, hiring freezes or market conditions. The one-line fix: compare the change in the treatment group with the change in a credible control group.
What to Revise Next
Now move from “how to test one HR intervention” to “how to build an evidence-based HR argument end to end.” Revise these next:
Mark Lesson Complete (Running an HR Intervention Experiment: Interview-Ready Framework to Prove What Works)