
Machine Learning Forecasting: Where AI Beats Statistics
A sunscreen brand can sell steadily for months, then suddenly spike because a heatwave, a creator video and a marketplace discount collide in the same week. A clean moving average sees only the past; a machine learning forecast can learn from the signals around the past.
- Machine learning forecasting predicts future demand by learning patterns from many historical and external variables.
- Classical statistics works best when demand is stable, history is long, and the pattern is mainly trend plus seasonality.
- ML beats statistics when demand is signal-rich, nonlinear, local, promotion-led, weather-sensitive or influenced by many small drivers.
- The best forecast is not the most complex model; it is the model that improves business decisions after bias, accuracy and cost are tested.
- Use ML for granular SKU-store-day forecasts, not just one national monthly number.
- Track WAPE, bias, RMSE, service level and stockout or waste impact - accuracy without business impact is vanity.
- The interview-safe line: “Statistics explains the base pattern; ML adds signal learning where drivers interact.”
Big Picture: ML Forecasting Is Not “Better Statistics” - It Is Signal Learning
Traditional forecasting asks, “What pattern exists in the demand history?” Machine learning forecasting asks a wider question: “Which signals around demand help predict what happens next?” That shift matters in modern supply chains because demand is shaped by price, search, point-of-sale movement, weather, promotions, local events, inventory availability and competitor actions.
Core Explanation: Where AI Actually Beats Classical Forecasting
The clean way to understand the topic is not “AI versus statistics.” It is base pattern versus signal complexity.
Classical time-series methods - moving averages, exponential smoothing, ARIMA-style models - are strong when demand has a stable structure. They capture level, trend and seasonality well. If you need a refresher on those building blocks, revise time series forecasting with trend, seasonality and smoothing before going deeper into ML.
Machine learning becomes useful when the forecast depends on several variables interacting at once. For example, ice cream demand may rise with temperature, but the effect may be stronger on weekends, different by city, muted during heavy rain, and amplified by a discount. A linear seasonal model struggles with this web of interactions; an ML model can learn them from data.
Statistics vs ML Forecasting: The Interview Comparison
The Four Conditions for ML to Beat Statistics
Use this as your mental checklist. If these four conditions are not present, ML may look impressive but add little value.
This is why demand sensing using signals and point-of-sale data is the natural companion topic. Without useful signals, an ML model only becomes a complicated way of averaging the past.
Key Metrics: How to Judge Whether ML Forecasting Worked
Never say “the ML model is more accurate” without naming the metric. In planning interviews, accuracy is not one number; it is a family of measures that answer different questions.
If you want the deeper measurement toolkit, revise measuring forecast accuracy and bias after this lesson.
Worked Example: ML Wins Only If the Error Falls Where It Matters
Assume a planner compares a statistical forecast and an ML forecast for four high-value city-SKU combinations. This is a toy example for calculation practice.
For the statistical model, absolute errors are 10, 30, 30 and 30. Total absolute error = 100. Total actual demand = 500. So WAPE = 100 / 500 = 20 percent.
For the ML model, absolute errors are 4, 10, 10 and 5. Total absolute error = 29. So WAPE = 29 / 500 = 5.8 percent.
The answer is not “ML is cool.” The answer is: ML reduced weighted error on important demand points, so it can improve replenishment and stock allocation.
Definitions You Can Say in One Breath
Tom Mitchell defines learning as performance improving with experience on a task and measure in Machine Learning.
- Forecasting: Estimating future demand or outcomes using historical data, causal signals and managerial judgment.
- Machine learning forecasting: Forecasting that uses algorithms to learn predictive patterns from demand history and related signals.
- Feature: An input variable used by a model, such as price, day of week, weather, promotion or stock availability.
- Overfitting: When a model learns noise in past data and performs poorly on new data.
- Forecast bias: A consistent tendency to over-forecast or under-forecast demand.
Licious: Forecasting When Unsold Demand Spoils
Licious is a useful Indian case because fresh meat and seafood demand turns forecasting accuracy into a direct trade-off between availability, freshness and waste.
In a packaged goods business, an over-forecast may sit in inventory for weeks. In a fresh meat and seafood business, the same forecasting error can become spoilage, emergency discounting or a lost customer who switches to a local store. That makes Licious a strong example of why ML forecasting matters in Indian consumer supply chains.
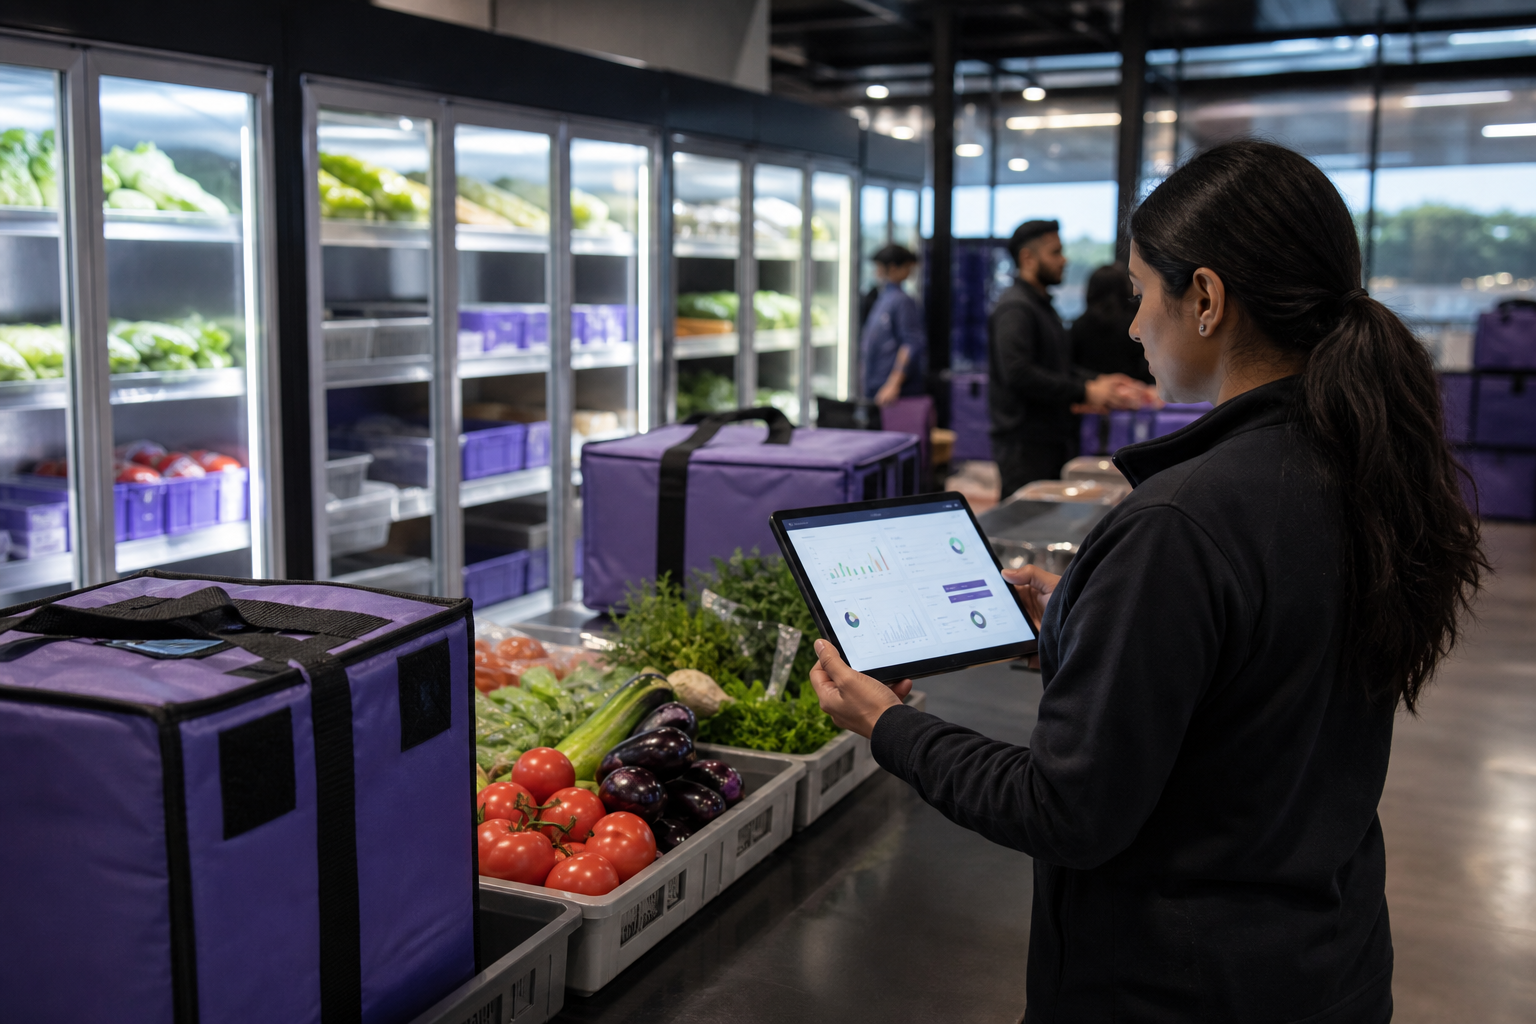
The situation is signal-rich. Demand can vary by city, locality, weekday, festival, salary cycle, weather, product type, delivery slot and marketing push. A purely statistical model may capture weekly seasonality, but it may miss how those drivers interact - for example, a weekend promotion behaving differently in Bengaluru than in Gurugram, or a premium SKU behaving differently from a daily-use item.
The strategic move in this type of business is to combine the statistical baseline with ML-driven local signals. The model should not only predict total demand; it should support procurement, cold-chain movement, fulfilment staffing and last-mile readiness.
The lesson: ML’s primary driver of value here is granular signal learning. The supporting drivers are cold-chain discipline, clean transaction data, promotion tracking, and planners who convert the forecast into procurement and replenishment decisions. A model alone does not create freshness; the operating system around the model does.
How AI Changes Machine Learning Forecasting
By 2026, the shift is from “build one forecast model” to “run an intelligent forecasting system.” Three changes matter most for MBA interviews:
- Foundation-style time-series models speed up experimentation. Teams can test broader model families faster, especially across many SKUs, instead of hand-tuning one method for every item.
- AI makes unstructured signals usable. Planner notes, promotion calendars, customer reviews, store comments and sales call summaries can be converted into structured features or explanations.
- GenAI improves forecast explainability. A planner can ask, “Why did the model increase demand for this SKU next week?” and receive a signal-based explanation - promotion, weather, recent sales velocity or stock recovery.
Practical student workflow: load this lesson, a company annual report and any demand-planning notes into NotebookLM. Ask it to generate interview questions on “where ML forecasting would improve the company’s planning cycle,” then answer using the structure below.
Interview Relevance
“When would you use machine learning for demand forecasting instead of a traditional statistical method? Give an example.”
A high-quality answer says, “I would not replace statistics blindly. I would benchmark ML against a statistical baseline and use it only where it improves planning outcomes.”
Common Mistake
The mistake is saying “AI is more accurate” without explaining where, why and how measured. It costs candidates because it sounds like tool worship, not managerial thinking. The fix: always connect ML to signal richness, nonlinear demand and metrics like WAPE, bias and service impact.