Market Sizing Using TAM, SAM and SOM: India EV 2-Wheeler Worked Skeleton
In the previous lesson on "Six Categories of Guesstimates - Which Technique for Which Problem", market sizing was one of the core problem types because it tests structure more than sector knowledge. This lesson zooms into that category and answers a specific interview question: how do you move from total market potential to a realistic revenue opportunity? The key is the layered TAM, SAM and SOM decomposition, shown through India’s EV 2-wheeler market for FY26.
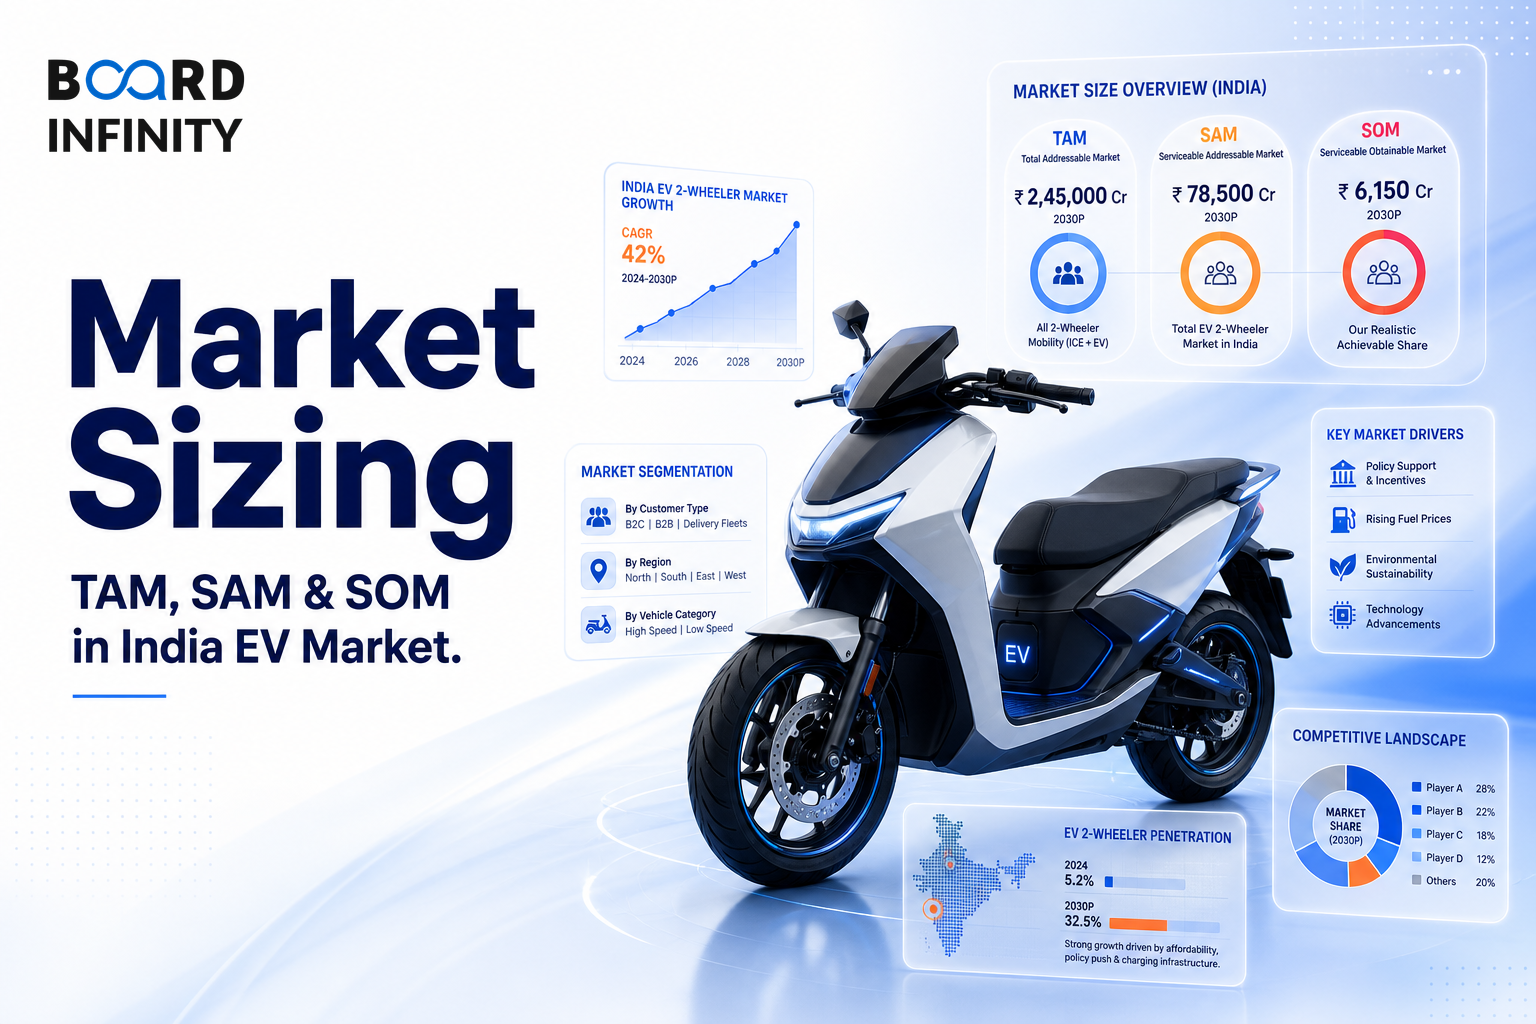
- TAM is the total available market - the broadest possible market before filtering for fit or realistic capture.
- SAM is the serviceable market - the part of TAM that is relevant after segment filters such as urban-skew and EV-fit are applied.
- SOM is the obtainable market - the realistic share of SAM that can be captured in the time period being sized.
- For India’s FY26 EV 2-wheeler market, the source skeleton moves from ~1.9 cr units/yr to 86 lakh EV-fit units to 8.6 lakh EV units.
- The revenue answer comes from units multiplied by ASP, or average selling price: 8.6 lakh units × ~₹1.1 lakh ASP ≈ ₹9,500 cr.
- The strongest answers explicitly explain why TAM, SAM and SOM differ - typically infrastructure, price and behaviour.
The Big Picture: Market Sizing as a Layered Funnel
Market sizing is not a single number. In interviews, it is typically a funnel that starts with the widest possible market and then narrows through filters until it reaches a realistic, time-bound opportunity.
Why TAM, SAM and SOM Matter in Interviews
TAM means Total Available Market - the full market you could theoretically be addressing. SAM means Serviceable Available Market - the portion of TAM that is relevant after applying practical filters. SOM means Serviceable Obtainable Market - the realistic share that can be captured in the defined period.
This structure matters because many candidates produce a large number and stop. In the source skeleton, the total 2-wheeler market in India is ~₹1.6L cr, but the realistic FY26 EV revenue market is ~₹9,500 cr. Those are not interchangeable answers. One describes broad potential; the other describes obtainable revenue.
TAM → SAM → SOM = Total available market → serviceable market after filters → realistic obtainable market for the time period being sized.
The Default Approach: Top-Down, Then Filter
For market sizing, the source recommends a top-down approach: start from a broad base such as population or GDP, move through segment filters, and then apply willingness-to-pay or per-unit revenue. In the EV 2-wheeler case, the broad base is the total 2-wheeler market, not the EV market directly.
The top-down method is useful because it forces a disciplined sequence. First, identify the category universe. Second, remove segments that are not serviceable. Third, apply a realistic share. Fourth, convert units into revenue using ASP, or average selling price. In this skeleton, ASP appears twice: ~₹85k for the total 2-wheeler market and ~₹1.1 lakh for the EV revenue calculation.
The table also shows why market sizing should not be confused with other guesstimate categories. If the question is “How many dentists in Bangalore?”, the structure is a service-ratio problem. If the question is “Cups of chai sold in India daily?”, the structure is consumers × frequency × unit. For EV 2-wheelers, the relevant test is whether you can separate total category potential from serviceable and obtainable layers.
TAM: Total Available Market
TAM is the largest layer. It answers: “If we ignore serviceability and realistic capture for now, how large is the entire market?” In the source skeleton, TAM for India’s 2-wheeler market is calculated as ~1.9 cr units/yr × ~₹85k ASP = ₹1.6L cr.
This is a useful starting point because it anchors the total opportunity. But it is not yet an EV market answer. It includes the total 2-wheeler market before filtering for electric-replaceable users, urban-skew, or the realistic FY26 EV share.
TAM is the broadest market base: in this example, total 2-wheeler units per year multiplied by total 2-wheeler ASP.
The interview nuance is to say clearly, “This is my TAM, not my final EV market answer.” That one sentence signals that you understand the difference between total market potential and the narrower revenue pool that a business can realistically address.
SAM: Serviceable Available Market
SAM narrows TAM to the portion that is actually serviceable. In the source skeleton, the serviceable layer is called Electric-replaceable: roughly 70% of urban + large-city users, focused on scooters and commuter bikes.
The calculation is: 1.9 cr × 65% urban-skew × 70% EV-fit ≈ 86 lakh units. This step matters because not every 2-wheeler buyer has the same use case, readiness, or fit for EV replacement. The source specifically points to urban-skew and EV-fit as the filters used to move from TAM to SAM.
The practical lesson is that filters should be named, not hidden inside a blended percentage. A candidate who says “I will take 45% of the market” gives less confidence than a candidate who says “I will apply 65% urban-skew and then 70% EV-fit.” Naming the filters makes the structure auditable.
SOM: Serviceable Obtainable Market
SOM is the realistic obtainable layer for the time period in question. The source uses a realistic FY26 EV share of ~10% of SAM. That gives 8.6 lakh units.
The revenue step then applies the EV ASP: 8.6 lakh units × ~₹1.1 lakh ASP ≈ ₹9,500 cr revenue market. This is the most interview-ready answer because it is both time-bound and commercially meaningful. It does not just say how many vehicles could exist in theory; it estimates the FY26 revenue market.
Obtainable revenue market = SAM units × realistic share × ASP.
The nuance is that SOM is not simply a smaller number for the sake of being conservative. The source explicitly says the gap between TAM and SOM exists because of infrastructure, price and behaviour. A strong answer names those constraints before presenting the final estimate.
Worked Example: India EV 2-Wheeler Market in FY26
This is a complete skeleton because it includes the situation, the problem, the framework, the decisions and the outcome. It also gives the interviewer a clear audit trail: if they disagree with the 65% urban-skew, 70% EV-fit, or 10% EV share, they can challenge a specific assumption instead of rejecting the entire answer.
How to Cross-Check the Answer
The quick reference in the source lists per-capita spend as the sanity-check anchor for market sizing. That does not mean every answer needs a full second model. It means your final number should be checked against a simple reasonableness test before you lock it.
For this example, the internal cross-check is whether the SOM revenue of ~₹9,500 cr is logically smaller than the TAM of ₹1.6L cr and whether the narrowing steps are explicit. If the answer jumps from ~1.9 cr units directly to revenue without explaining EV-fit or realistic share, it is structurally weak even if the arithmetic is neat.
Structuring a Market Sizing (TAM/SAM/SOM) with Worked Skeleton Interview Answer
"Size the EV 2-wheeler market in India for FY26."
The fastest way to improve your answer is to label each layer before calculating it. Say “This is TAM,” “Now I will filter to SAM,” and “Now I will estimate SOM.” Interviewers reward the structure because it prevents the common error of treating the total market as the obtainable market.
Conclusion
Market sizing with TAM, SAM and SOM is a layered decomposition: begin with the total available market, filter to the serviceable market, and then estimate the realistic obtainable opportunity. In the India EV 2-wheeler FY26 skeleton, that discipline turns a broad ₹1.6L cr category view into a more interview-ready ~₹9,500 cr revenue market.
The most frequent error is reporting only TAM and stopping. It costs points because the interviewer is testing whether you can explain the gap between total potential and realistic capture - especially the role of infrastructure, price and behaviour.