
Power BI Fundamentals for Analysts: Workflow and Tableau Comparison
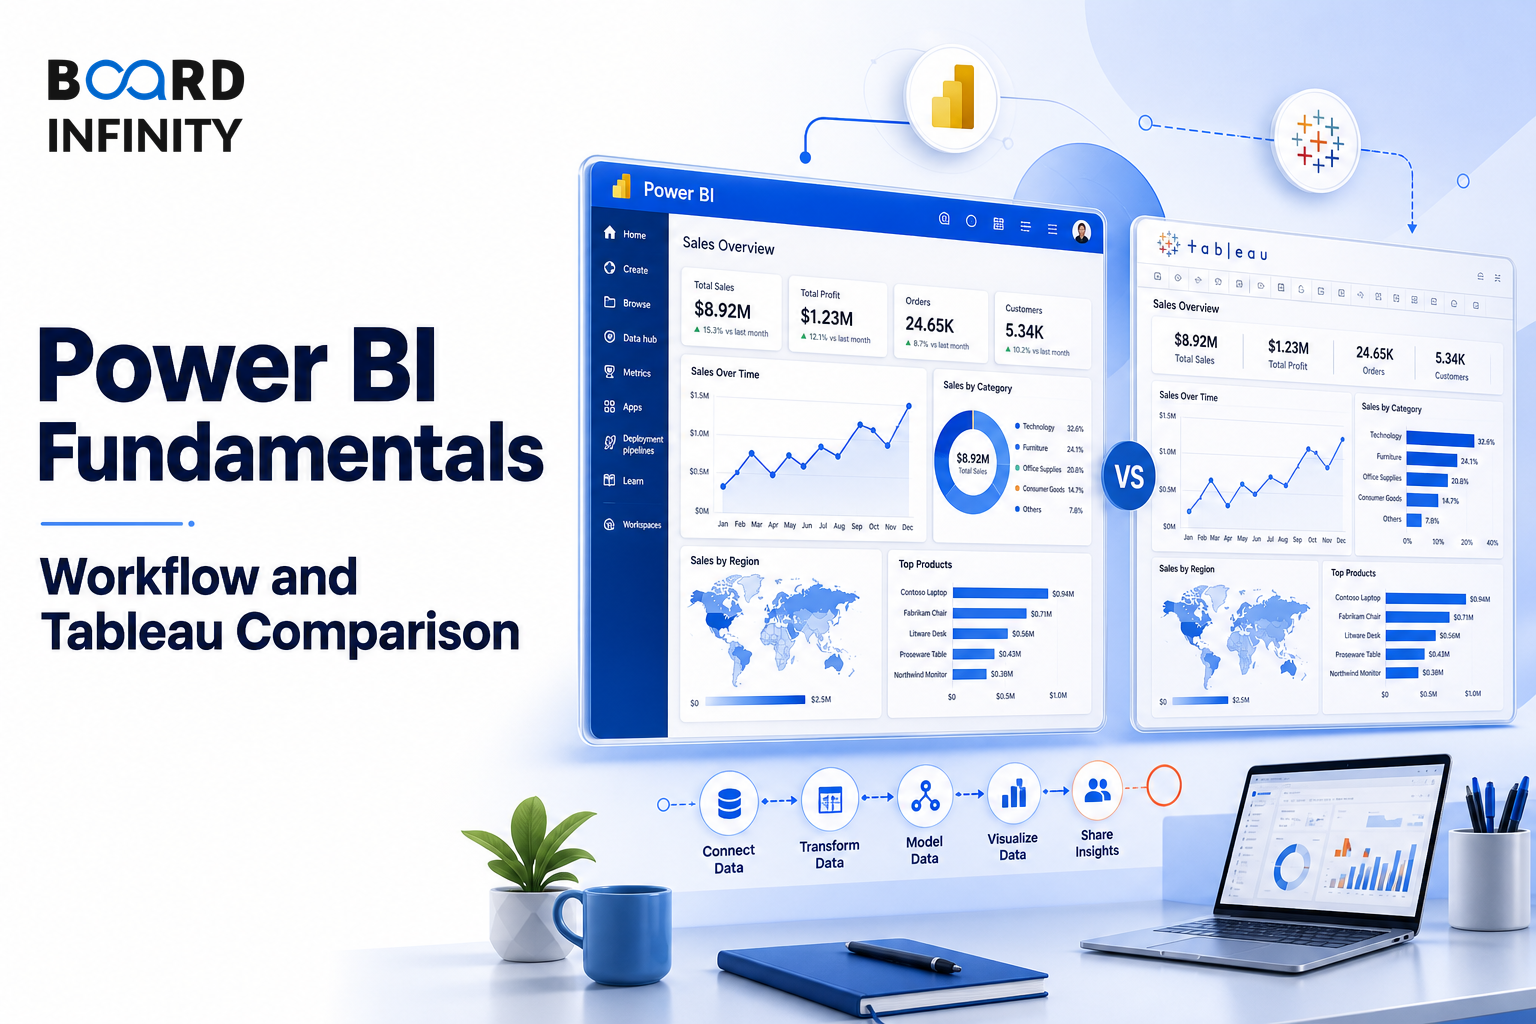
After Tableau Fundamentals for Analysts, the next question is how Power BI works as an end-to-end analyst workflow from data preparation to cloud sharing. Power BI is frequently discussed in interviews because it connects Power Query, data modelling, DAX calculations, visuals, reports, and Power BI Service into one reporting flow. A strong answer should also benchmark it against Tableau on pricing, ease of use, modelling, calculations, integrations, and adoption.
- Power BI follows the workflow: Power Query - ETL & Data Prep, Data Model - Relationships & Schema, DAX Engine - Calculations & KPIs, Visuals - Charts & Reports, Power BI Service - Cloud Sharing & Collaboration.
- Power BI pricing includes Free Desktop; Pro: ~$10/user/mo; Premium: $20+, while Tableau Creator is ~$70/user/mo and significantly more expensive.
- Power BI is easier for Excel users because of the familiar ribbon interface, while Tableau has a steeper curve but more visual flexibility.
- DAX uses row-context vs filter-context and is powerful but complex; Tableau uses LOD expressions that are more intuitive for analysts.
- Power BI supports star schema relationships in the Power Pivot engine, while Tableau joins are managed in the data source with less flexible modelling.
- Power BI has deep Microsoft 365 / Azure integration, while Tableau connects strongly with the Salesforce ecosystem, Slack, and Google.
- Power BI is dominant in mid-market, BFSI, IT/ITeS, GCCs in India, while Tableau is dominant in large enterprises, product companies, MNCs.
Power BI as an End-to-End Analyst Workflow
Power BI fundamentals are best understood as a flow, not as isolated features. The analyst starts with Power Query for ETL & Data Prep, builds a Data Model with relationships & schema, writes DAX Engine calculations & KPIs, creates Visuals as charts & reports, and then uses Power BI Service for cloud sharing & collaboration.
Power Query: ETL & Data Prep
Power Query is the data preparation layer in the Power BI workflow. Its flow is Connect, Transform, Load, and Refresh, which makes the cleaning process recorded, repeatable, and refreshable when new data arrives.
Never manually clean data in Excel cells - always use Power Query steps. Steps are recorded, repeatable, and refresh automatically when new data arrives.
Worked Example: Consolidating Distributor Sales Reports
FMCG companies such as HUL, Nestlé, ITC use Power Query extensively to consolidate monthly distributor sales reports from 50+ Excel files into a single dashboard. The situation is monthly distributor sales reports across many files, the problem is consolidation, the framework is Connect, Transform, Load, and Refresh, and the outcome is a single dashboard.
The learning is the Power Query best practice: do not manually clean data in Excel cells. Use Power Query steps because the steps are recorded, repeatable, and refresh automatically when new data arrives.
Data Model: Relationships & Schema
The Data Model stage is about relationships & schema. In Power BI, the comparison point is star schema relationships in the Power Pivot engine, while Tableau has joins managed in the data source and less flexible modelling.
This matters in analyst interviews because Power BI is not only a charting layer. Its modelling layer is part of the workflow between Power Query and DAX Engine calculations & KPIs.
DAX Engine: Calculations & KPIs
The DAX Engine is used for calculations & KPIs. The key DAX patterns to know are CALCULATE, FILTER, ALL, ALLEXCEPT, RELATED, DATEADD, and TOTALYTD.
The main comparison with Tableau is DAX vs LOD. DAX is row-context vs filter-context - powerful but complex, while LOD expressions are more intuitive for analysts.
Visuals, Reports, and Power BI Service
After calculations & KPIs, Power BI moves into Visuals, which are charts & reports. The final stage is Power BI Service, which supports cloud sharing & collaboration.
For collaboration, Power BI Service is described as cloud share, and Power BI supports scheduled refresh. This makes Power BI useful for dashboards, reporting, and stakeholder communication.
Power BI vs Tableau: Interview Comparison
The Power BI vs Tableau comparison should be structured across pricing, ease of use, calculations, data model, mobile support, integration, Indian adoption, and key DAX patterns. Power BI is especially strong for Excel users, Microsoft 365 / Azure integration, star schema relationships, and Power BI Service cloud sharing.
Tableau is positioned differently: it has a steeper curve but more visual flexibility, uses LOD expressions that are more intuitive for analysts, and is integrated with the Salesforce ecosystem, Slack, and Google.
Structuring a Power BI Fundamentals for Analysts Interview Answer
"Walk me through Power BI fundamentals and compare Power BI with Tableau."
The strongest answer does not stop at charts. It explains the full flow from Power Query to Power BI Service and then compares Power BI with Tableau using the same dimensions.
The most frequent error is treating Power BI as only a visuals and reports tool. That misses the full workflow: Power Query, Data Model, DAX Engine, Visuals, and Power BI Service, and it costs points because interviewers expect modelling, calculations, and sharing to be covered.
Conclusion
Power BI fundamentals are about the complete analyst workflow: preparing data, modelling relationships, calculating KPIs, building reports, and sharing them through the cloud. In interviews, the final takeaway is to explain Power BI end to end and benchmark it clearly against Tableau.