
Capital Structure: Debt vs Equity and Optimal Leverage
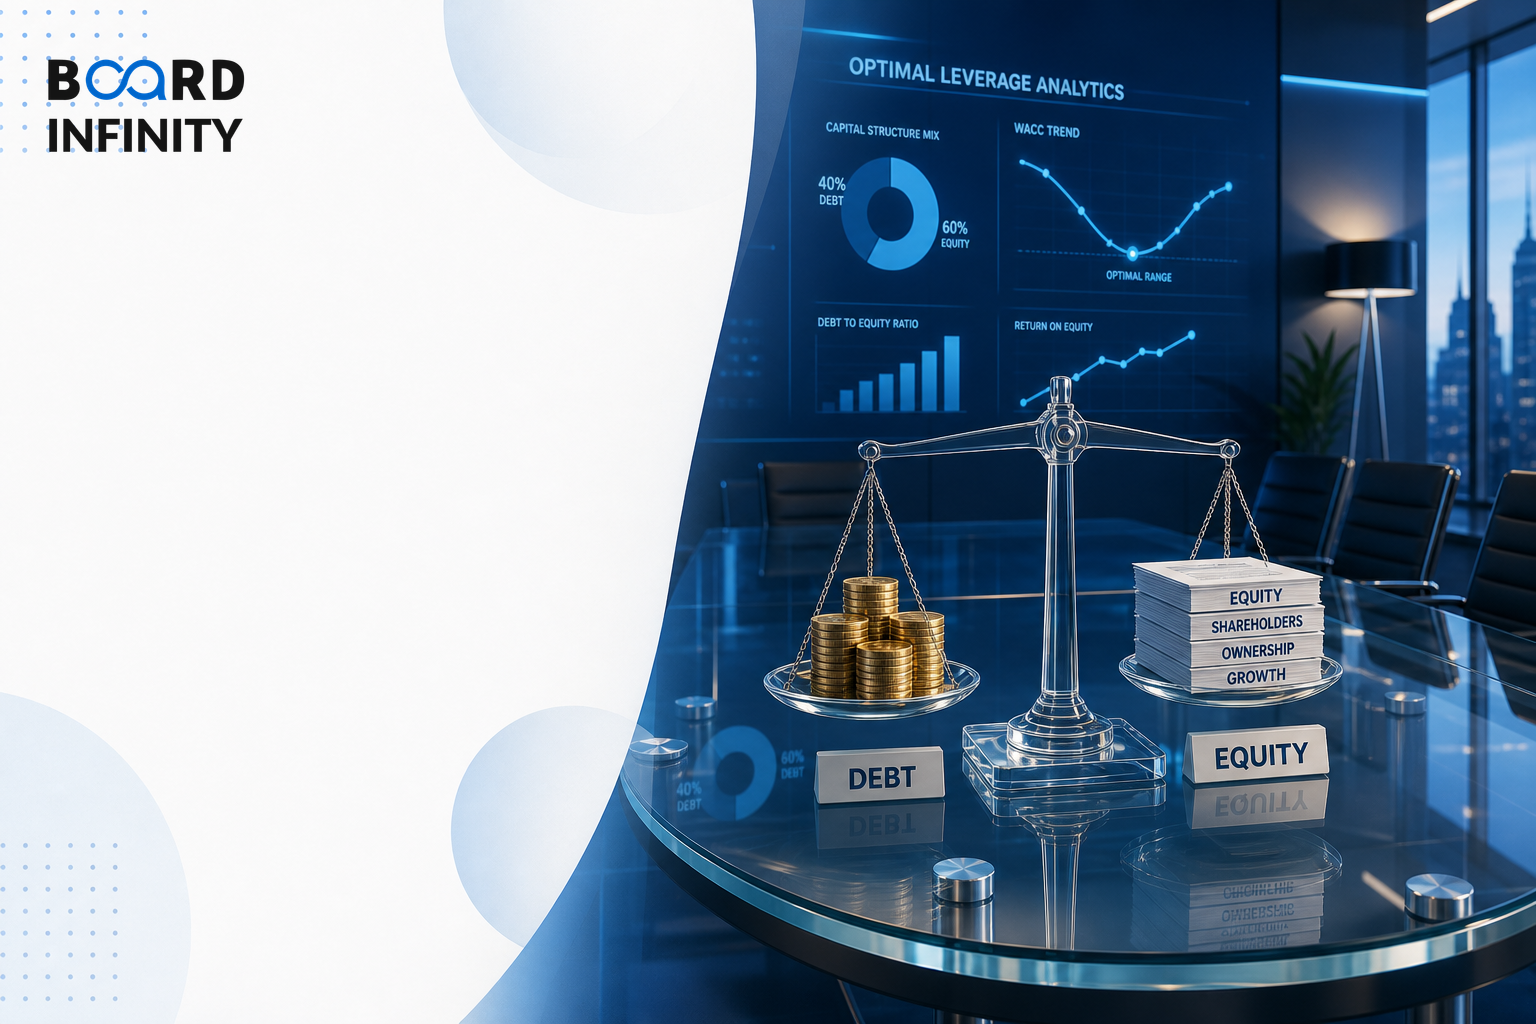
After Cost of Capital & WACC Explained, the next question is practical: what mix of debt and equity should a firm use to finance operations and growth? Capital structure matters in interviews because it connects cheaper debt, rising equity risk, tax shields, financial distress costs, and sector-specific D/E ratio benchmarks.
- Capital structure refers to the mix of debt and equity a firm uses to finance its operations and growth.
- The central question: Is there an optimal D/E ratio that minimizes WACC and maximizes firm value?
- MM Proposition I (No Tax) says firm value is independent of capital structure in perfect markets.
- MM Proposition II (No Tax) says cost of equity rises with leverage as equity becomes riskier.
- MM with Tax says debt creates a tax shield because interest is tax deductible, but it ignores financial distress costs.
- Trade-off Theory says optimal capital structure balances tax shield benefits vs financial distress costs.
- Indian D/E benchmarks differ by sector, from near-zero debt in IT Services to high structural leverage in Telecom, Infrastructure, PSU Banks, and NBFCs.
Capital Structure in the WACC Question
Weighted Average Cost of Capital (WACC) is the blended cost of debt and equity capital. Capital structure asks whether the debt-to-equity (D/E) ratio can be chosen so that WACC is minimized and firm value is maximized.
Capital structure refers to the mix of debt and equity a firm uses to finance its operations and growth. The central question: Is there an optimal D/E ratio that minimizes WACC and maximizes firm value?
Optimal Capital Structure
The optimal capital structure question is about the relationship between Cost of Capital (%) and Debt / Total Capital (%). The visual logic compares 0%, 20%, 40%, 60%, 80%, and 100% debt / total capital against WACC, Cost of Equity (Ke), Cost of Debt (Kd), and Optimal D/E.
The practical trade-off is visible across the theories. Debt can be cheaper and creates a tax shield, but cost of equity rises with leverage as equity becomes riskier, and financial distress costs can reduce value.
Indian D/E Benchmarks by Sector
Indian sector benchmarks show why the optimal D/E ratio is not one-size-fits-all. Cash-generative sectors can operate with near-zero debt, while capital-intensive or regulated models can carry structurally higher leverage.
How to Use Sector Benchmarks in Analysis
For IT Services, TCS, Infosys, and Wipro sit in a 0 - 0.1x D/E range because the sector is cash-generative, has no need for debt, and carries near-zero debt. For FMCG, HUL, Nestle, and Dabur sit in a 0 - 0.3x range because negative WC allows self-financing through payables.
For Pharma, Sun Pharma and Dr Reddy sit in a 0.2 - 0.5x range because of moderate R&D, capex, and conservative leverage. At the other end, Telecom has a 2.0 - 4.0x D/E range because massive spectrum and network capex make high debt structural.
Structuring a Capital Structure Interview Answer
"Is there an optimal D/E ratio that minimizes WACC and maximizes firm value?"
The strongest answer does not stop at “debt is cheaper.” It connects cheap debt to rising Ke, tax shield benefits, financial distress costs, and sector-specific D/E benchmarks.
The common mistake is saying firms should borrow as much as possible to maximize the tax shield. That misses the Trade-off Theory point: optimal capital structure balances tax shield benefits vs financial distress costs, and the right D/E ratio differs by sector.
Conclusion
Capital structure is the practical decision of mixing debt and equity to finance operations and growth while minimizing WACC and maximizing firm value. The key takeaway is that optimal leverage depends on the trade-off between tax shields, rising equity risk, distress costs, and sector-specific D/E benchmarks.