Cost of Capital, Beta & the CAPM Model for Valuation
In Corporate Finance Decisions - Capital Structure & WACC, the central idea was that a business funds itself through a mix of equity and debt. This lesson answers the next valuation question: what return should investors demand for that mix, and what discount rate should an analyst use? In interviews at firms such as EY and Deloitte, Cost of Capital, beta and the Capital Asset Pricing Model are tested because they connect market risk, capital structure and valuation into one practical framework.
- WACC, or Weighted Average Cost of Capital, is the blended discount rate for a company funded by equity and debt.
- The core formula is WACC = Ke × [E/(D+E)] + Kd × (1-T) × [D/(D+E)].
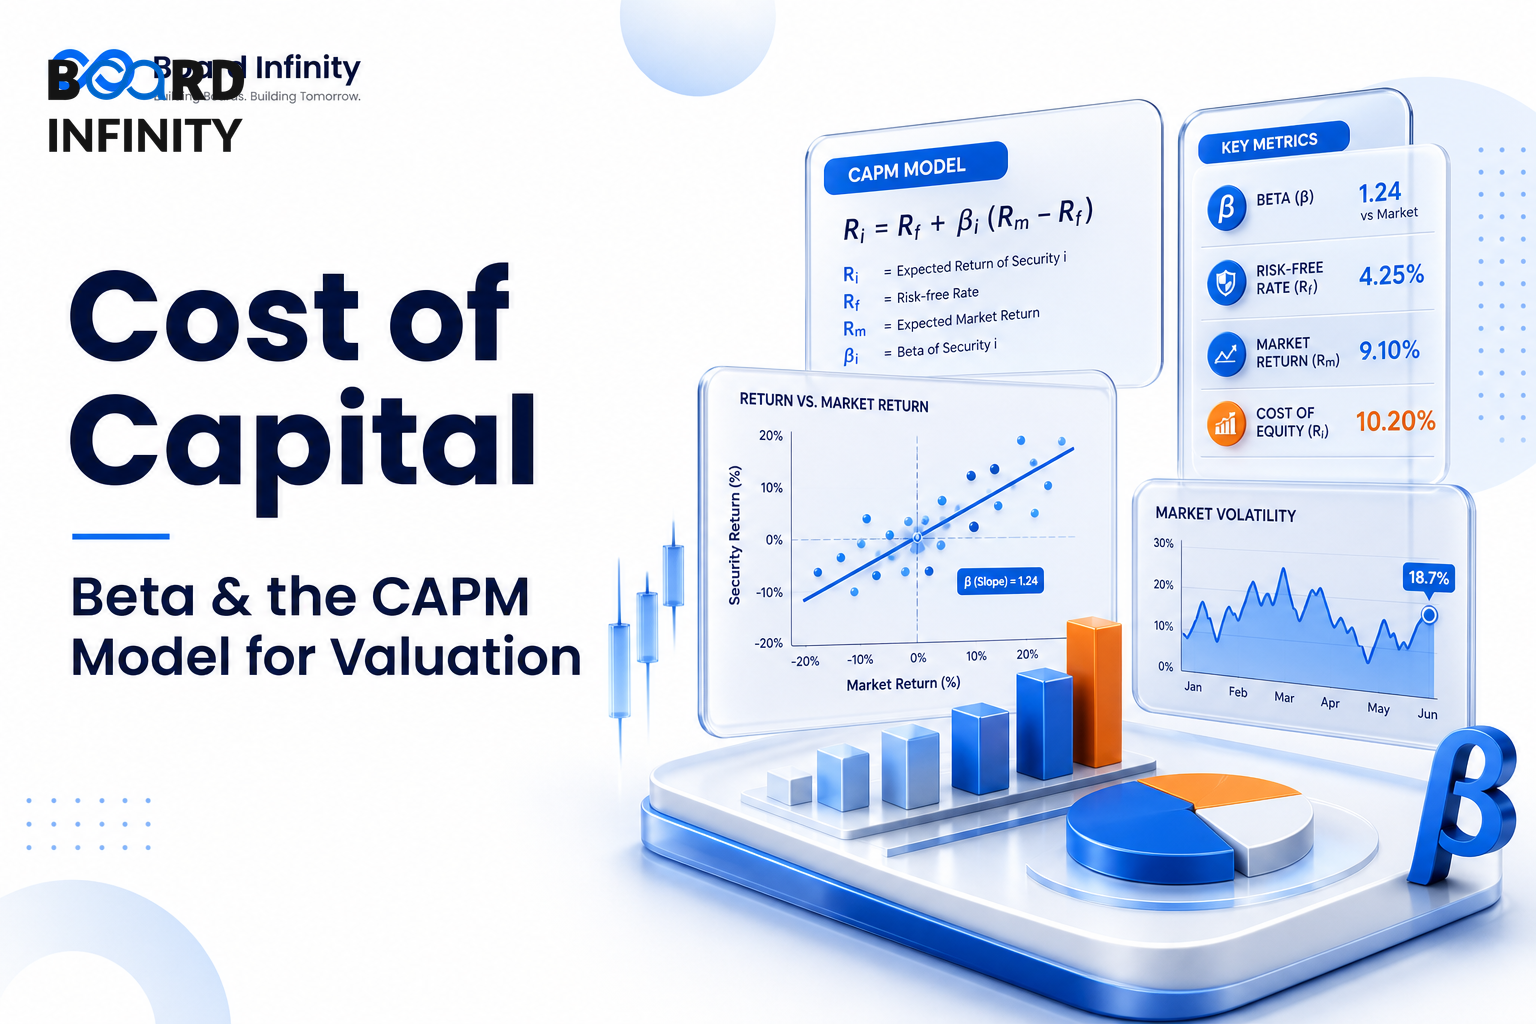
- Cost of Equity, or Ke, is typically estimated using the Capital Asset Pricing Model: Ke = Rf + β × (Rm - Rf).
- For India, the risk-free rate, or Rf, is commonly proxied by the 10Y G-Sec yield of approximately 7.0% in the source assumptions.
- The Market Risk Premium, or Rm - Rf, is 5.0-6.0%, with 5.5% used in the sector estimates.
- Beta varies by sector: IT Services such as TCS and Infosys show 0.60-0.75, while Infra / Real Estate shows 1.00-1.20.
- After-tax Cost of Debt is Kd × (1 - Tax Rate), using a 25% tax rate in the source assumptions.
The Big Picture - From Market Risk to Valuation Discount Rate
Cost of Capital is best understood as a build-up from investor expectations to a company-specific discount rate. Equity investors require compensation for market risk through CAPM, debt holders require interest adjusted for tax, and WACC combines both based on the debt-equity mix.
Weighted Average Cost of Capital is the company-level discount rate built from Cost of Equity, after-tax Cost of Debt and the proportion of equity and debt in the capital structure.
For TCS, the source uses Rf = 7.0%, beta = 0.65 and Market Risk Premium = 5.5%. Cost of Equity is 7% + 0.65×5.5% = 10.6%. Since TCS has near zero debt, WACC is approximately equal to Ke, giving a WACC estimate of about 10.5-11%.
Understanding WACC
WACC stands for Weighted Average Cost of Capital. It represents the blended return expected by the providers of capital: equity shareholders and debt holders. In valuation, WACC is used as a discount rate because future cash flows must be discounted at a rate that reflects the risk and financing mix of the business.
The formula is WACC = Ke × [E/(D+E)] + Kd × (1-T) × [D/(D+E)]. Here, Ke means Cost of Equity, Kd means Cost of Debt, T means tax rate, E means equity value and D means debt value. The debt component is multiplied by (1-T) because interest cost creates a tax shield, reducing the effective cost of debt.
The key interview point is that WACC is not a generic number. It changes with sector risk, beta, debt cost, tax rate and capital structure. A low-debt IT Services company such as TCS will have WACC close to Cost of Equity, while a high-debt sector such as Telecom can have a lower WACC estimate because debt is cheaper after tax.
Cost of Equity and CAPM
CAPM stands for Capital Asset Pricing Model. It estimates the return required by equity investors based on the risk-free rate, the company or sector beta, and the market risk premium. The formula is Ke = Rf + β × (Rm - Rf).
Rf means risk-free rate. In the India assumptions given, it is the 10Y G-Sec yield, approximately 7.0%. G-Sec means Government Security, and the 10-year government bond yield is used as a proxy for the risk-free rate because it represents a sovereign borrowing benchmark. Rm means expected market return, and Rm - Rf is the Market Risk Premium, or MRP, which is 5.0-6.0% in India based on the source, with 5.5% used in the sector table.
Beta, written as β, is the risk sensitivity input. If beta is high, Cost of Equity rises because equity investors expect more return for taking more market-linked risk. If beta is low, Ke falls. This is why FMCG companies such as HUL and Nestle, with beta of 0.40-0.55, have lower Cost of Equity estimates than Infra / Real Estate, where beta is 1.00-1.20.
Beta - Why Sector Risk Changes the Discount Rate
Beta is the bridge between market risk and company valuation. In simple terms, it tells the analyst how sensitive the company or sector is to market movements. A sector with beta below 1.00 is relatively less market-sensitive in the source assumptions, while a sector around or above 1.00 carries higher equity risk.
The source shows meaningful sector variation. IT Services such as TCS and Infosys have beta of 0.60-0.75 and Cost of Equity of 10.3-11.1%. FMCG companies such as HUL and Nestle have beta of 0.40-0.55 and Cost of Equity of 9.2-10.0%. Private Banks such as HDFC Bank and Kotak Mahindra Bank have beta of 0.80-1.00 and Ke of 11.4-12.5%.
The nuance is that beta should be interpreted with the business model. A bank may show high leverage in accounting terms, but the source treats deposits as not debt for Cost of Capital. Therefore, for private banks, the WACC estimate is shown as 12-14% on a Ke-based basis rather than a standard industrial WACC with debt and equity weights.
Cost of Debt and the Tax Shield
Cost of Debt, or Kd, is the borrowing cost of the company. For WACC, the relevant figure is after-tax Cost of Debt because interest expense reduces taxable income. The formula is Kd(after-tax) = Kd × (1 - Tax Rate).
For India, the source gives corporate tax rate as 22% under the new regime or 25-30% under the old regime, with an effective rate of approximately 25%. The sector table uses a tax rate of 25%. This means a pre-tax debt cost becomes lower after tax, making debt cheaper than equity in many WACC calculations.
This is why capital structure matters. Telecom, represented by Bharti Airtel in the source, has beta of 0.75-0.90, Cost of Equity of 11.1-12.0%, after-tax Cost of Debt of 6.0%, and D/E Ratio of 2-3x. The WACC estimate is 9-11%, with the note that high debt lowers WACC.
Worked Example - TCS WACC Calculation
A complete valuation answer should not stop at quoting the formula. It should show how the assumptions flow into a decision on the discount rate. TCS is a useful example because the source provides the beta, market assumptions and capital structure interpretation.
The strategic takeaway is that WACC is not calculated mechanically. For TCS, the correct reasoning is that CAPM gives the equity return requirement, but near zero debt means the final WACC is almost the same as Cost of Equity.
How to Use WACC in Valuation Cases
In a case or finance interview, WACC is usually tested as a thinking framework rather than only as a formula. The interviewer wants to see whether you can identify the right discount rate, pick reasonable assumptions, and explain why different sectors have different costs of capital.
A strong answer begins with the company’s sector and capital structure. For TCS or Infosys, low debt means WACC is close to Ke. For HUL or Nestle, lower beta and negative working capital are relevant to the WACC discussion. For HDFC Bank or Kotak Mahindra Bank, deposits are not treated as debt for Cost of Capital in the source, so a Ke-based estimate is used. For Sun Pharma and Dr. Reddy's, beta and moderate D/E drive a WACC estimate around 10-11%.
The reusable structure is: estimate Ke using CAPM, estimate after-tax Kd, identify E and D weights, compute WACC, then sense-check the result against sector ranges. This final sense-check is often where candidates show maturity, because a calculated answer that is far away from the sector estimate should be questioned.
Structuring a Cost of Capital, Beta & the CAPM Model Interview Answer
"How would you estimate the WACC for an Indian company such as TCS, and how would the answer change for a more leveraged sector?"
The best candidates do not just plug numbers into CAPM. They explain why beta and capital structure differ by sector, and why banks, low-debt IT companies and high-debt telecom companies should not be treated the same way.
Conclusion
Cost of Capital, beta and CAPM convert market risk and financing choices into a valuation discount rate. The core takeaway is simple: build Ke using CAPM, adjust Kd after tax, weight both by capital structure, and always sense-check the WACC against the company’s sector profile.
The most frequent error is using one generic WACC for every company. This costs points because the source clearly shows sector-specific beta, debt cost and D/E differences - TCS, HDFC Bank, Bharti Airtel and Infra / Real Estate cannot be valued with the same capital-cost logic!