
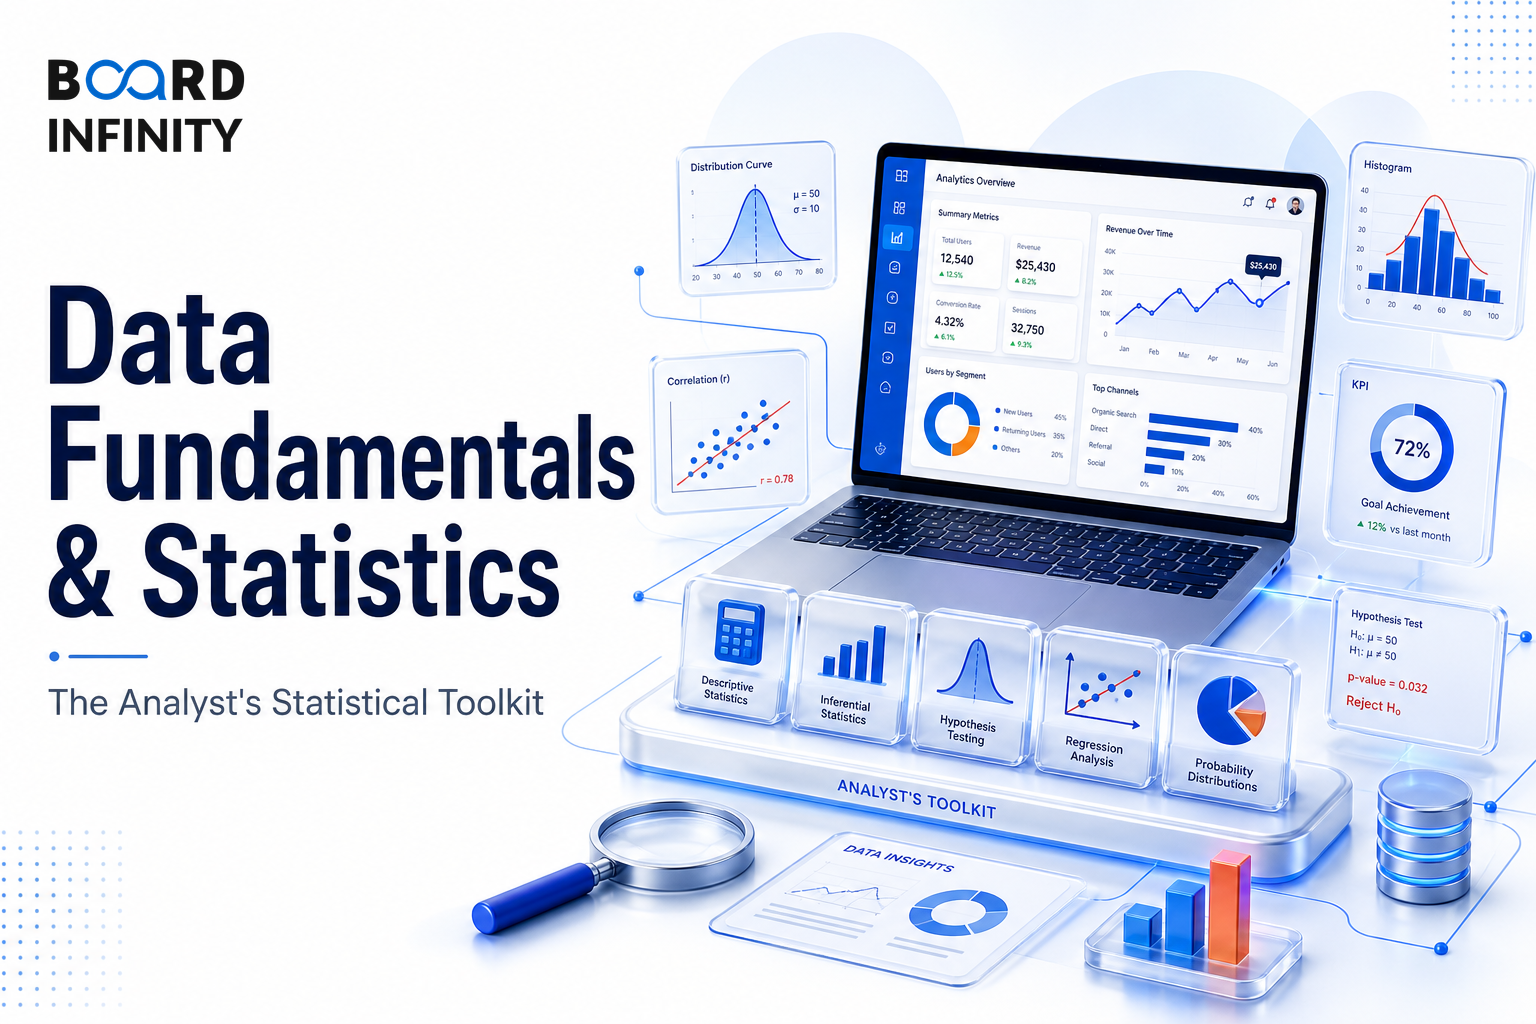
Data Fundamentals & Statistics: The Analyst's Statistical Toolkit is a structured track of 6 lessons that build a complete, interview-ready understanding of the topic. Work through them in order, then use the quiz and flashcards in each lesson to revise.
What this course covers
- Types of Data: Quantitative vs Qualitative Explained - Data Type Hierarchy: All data is either Quantitative (Discrete or Continuous) or Qualitative (Nominal or Ordinal).
- Descriptive Statistics for Analysts: Key Concepts Explained - Interview Favourite: 'Explain the difference between mean and median with an example' - appears in 70% of interviews Mean (x̄) = Σxᵢ / n Arithmetic average - sensitive to
- Probability Essentials for Analytics Interviews - P(A B) = P(A) × P(B|A) Joint probability - probability of both A and B occurring P(A|B) = P(A B) / P(B) Conditional probability - probability of A given B has occurred Ba
- Hypothesis Testing Explained: H0, H1, p-value & Significance - Hypothesis Testing Flow - 6 Steps Define H₀ & H₁ Null & Alternative → Choose Test t, z, chi-sq, ANOVA → Set α Usually 0.05 → Calculate Test Statistic From sample data → F
- Non-Parametric Tests: When Standard Statistical Tests Fail - Ch 2: Data Fundamentals & Statistics Reality Check: Indian startup data - Swiggy delivery times, Zomato ratings, UPI transaction values - is almost NEVER normally distrib
- Correlation vs Causation: Why the Difference Matters - The #1 Analytics Mistake: Confusing correlation with causation.