
Descriptive Statistics for Analysts: Key Concepts Explained
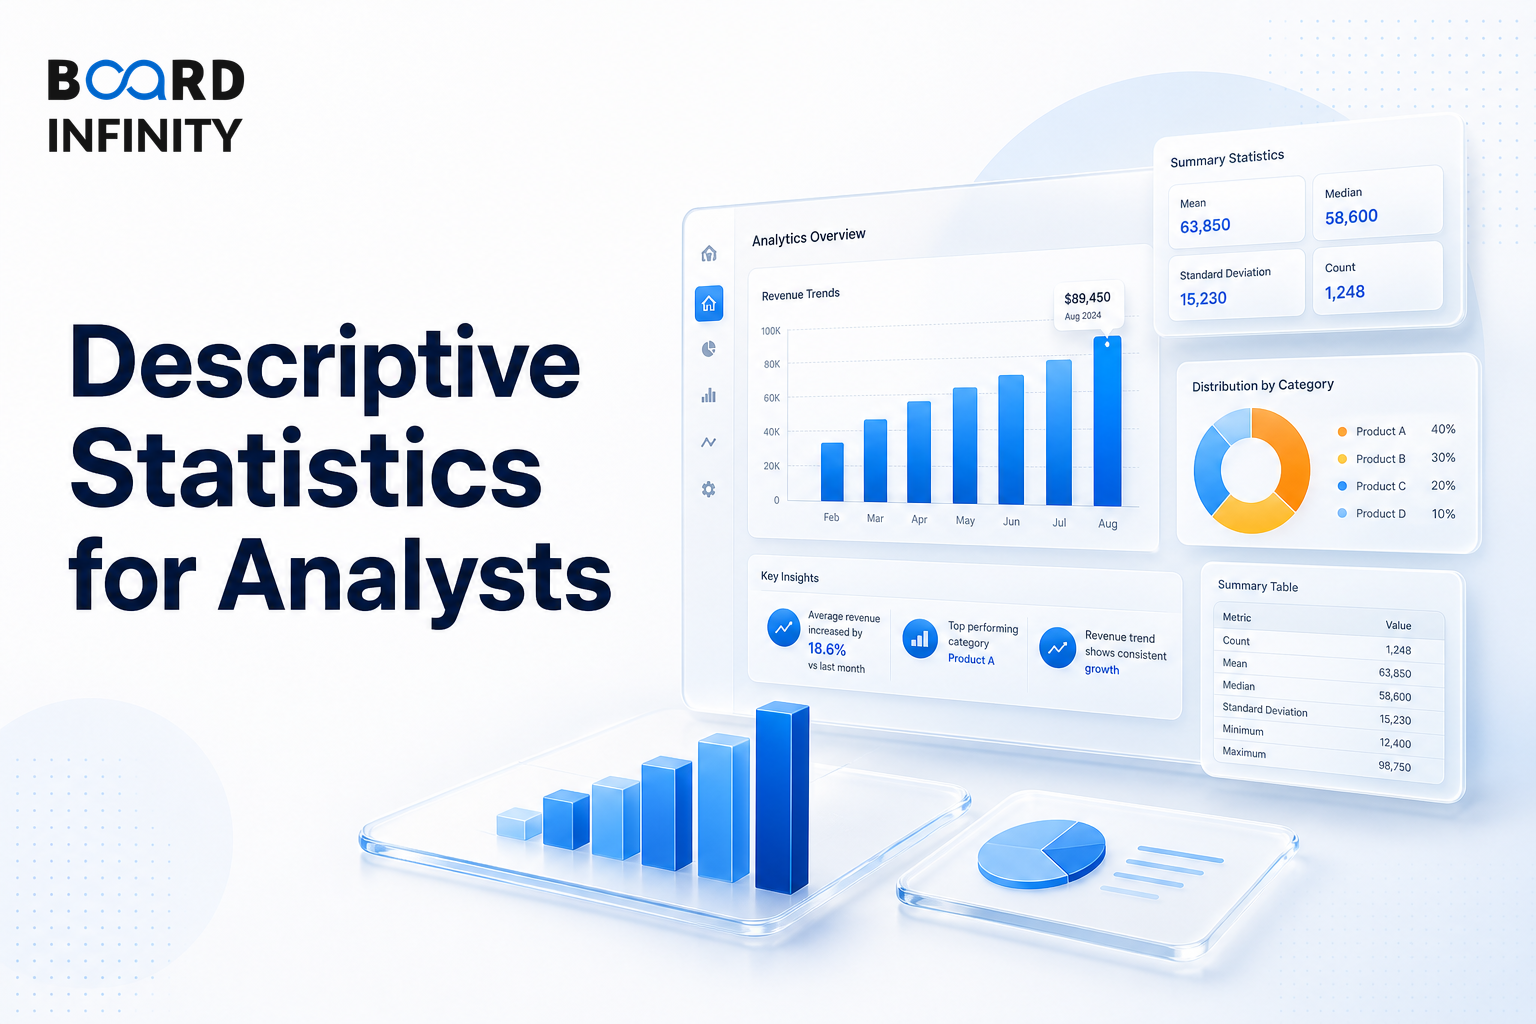
After identifying whether data is quantitative or qualitative, the next analyst question is which statistic summarises it correctly. Descriptive statistics give you the interview-ready toolkit for choosing the right measure of center or spread based on outliers, skewness, and business context. This matters because "Explain the difference between mean and median with an example" appears in 70% of interviews.
- Mean (x̄) = Σxᵢ / n is the arithmetic average - sensitive to outliers and best used with symmetric distributions.
- Median is the middle value when sorted - the 50th percentile and robust to outliers, so it is preferred for skewed data like salaries.
- Mode is the most frequent value - best for categorical data or finding the most common outcome.
- Range = Max - Min is a spread measure, but it is sensitive to outliers.
- Variance (σ²) = Σ(xᵢ - x̄)² / (n-1) is average squared deviation, with n-1 for sample and n for population.
- Std Dev (σ) = √Variance is the most used spread measure because it is in the same units as the data.
- IQR = Q3 - Q1 is a robust spread measure and is used to define outliers using the IQR x 1.5 rule.
Descriptive Statistics as a Selection Toolkit
Descriptive statistics help analysts summarise data using measures of center, spread, percentile position, and distribution shape. The interview skill is not just recalling formulas, but selecting the statistic that fits the data: mean for symmetric data, median and IQR for skewed data, and mode for categorical outcomes.
Mean (x̄) = Σxᵢ / n is the arithmetic average - sensitive to outliers. Median is the middle value when sorted - the 50th percentile and robust to outliers.
Measures of Center
Mean (x̄) = Σxᵢ / n is the arithmetic average. It is sensitive to outliers, so use it with symmetric distributions.
Median is the middle value when sorted. It is the 50th percentile and is robust to outliers, so prefer it for skewed data like salaries.
Mode is the most frequent value. It is best for categorical data or finding the most common outcome.
Measures of Spread
Range = Max - Min is a spread measure, but it is sensitive to outliers.
Variance (σ²) = Σ(xᵢ - x̄)² / (n-1) is average squared deviation. Use n-1 for sample and n for population.
Std Dev (σ) = √Variance is the most used spread measure because it is in the same units as the data.
IQR = Q3 - Q1 is the Interquartile Range. It is a robust spread measure, used to define outliers: IQR x 1.5 rule.
Outliers, Skewness and Salary Data
Skewness > 0 means right-skewed. In this case, Mean > Median > Mode, with a long right tail - typical of Indian income distributions.
This is why salary examples are so common in interviews. Mean can be pulled up by extreme values, while median remains a robust measure for skewed data, salary distributions.
Worked Example: Mean vs Median in MBA Salaries
Situation: In an Indian B-school example, the mean MBA salary is ₹18 LPA and the median MBA salary is ₹12 LPA.
Problem: Mean is HIGH - an Ambani skews the average. Median is LOW - robust measure.
Framework: Use mean for symmetric, normally distributed data. Use median for skewed data, salary distributions.
Decision: If asked to explain placement salaries, state both values and explain that the median better represents the typical salary when the distribution is skewed.
Learning: The right measure depends on outliers, skewness, and the business context.
Normal Distribution Reference
Normal distribution is where the 68-95-99.7 rule is used to understand how much data falls within one, two, or three standard deviations from the mean.
Did You Know? Despite being called 'normal' distribution, most real-world Indian business data - income, website traffic, viral content shares, startup valuations - follows a power-law or log-normal distribution, not a normal distribution.
Structuring a Descriptive Statistics for Analysts Interview Answer
"Explain the difference between mean and median with an example"
Do not stop at formula recall. Interviewers expect you to explain why median is preferred for skewed salary data and why mean works better with symmetric distributions.
Conclusion
Descriptive statistics are not just formulas - they are choices. The strongest analyst answer connects the measure of center or spread to the data shape, outlier sensitivity, and the business question being answered.
The most frequent error is using mean for skewed data like salaries without checking outliers. This costs points because mean is sensitive to outliers, while median and IQR are robust measures for skewed distributions.