
Correlation vs Causation: Why the Difference Matters
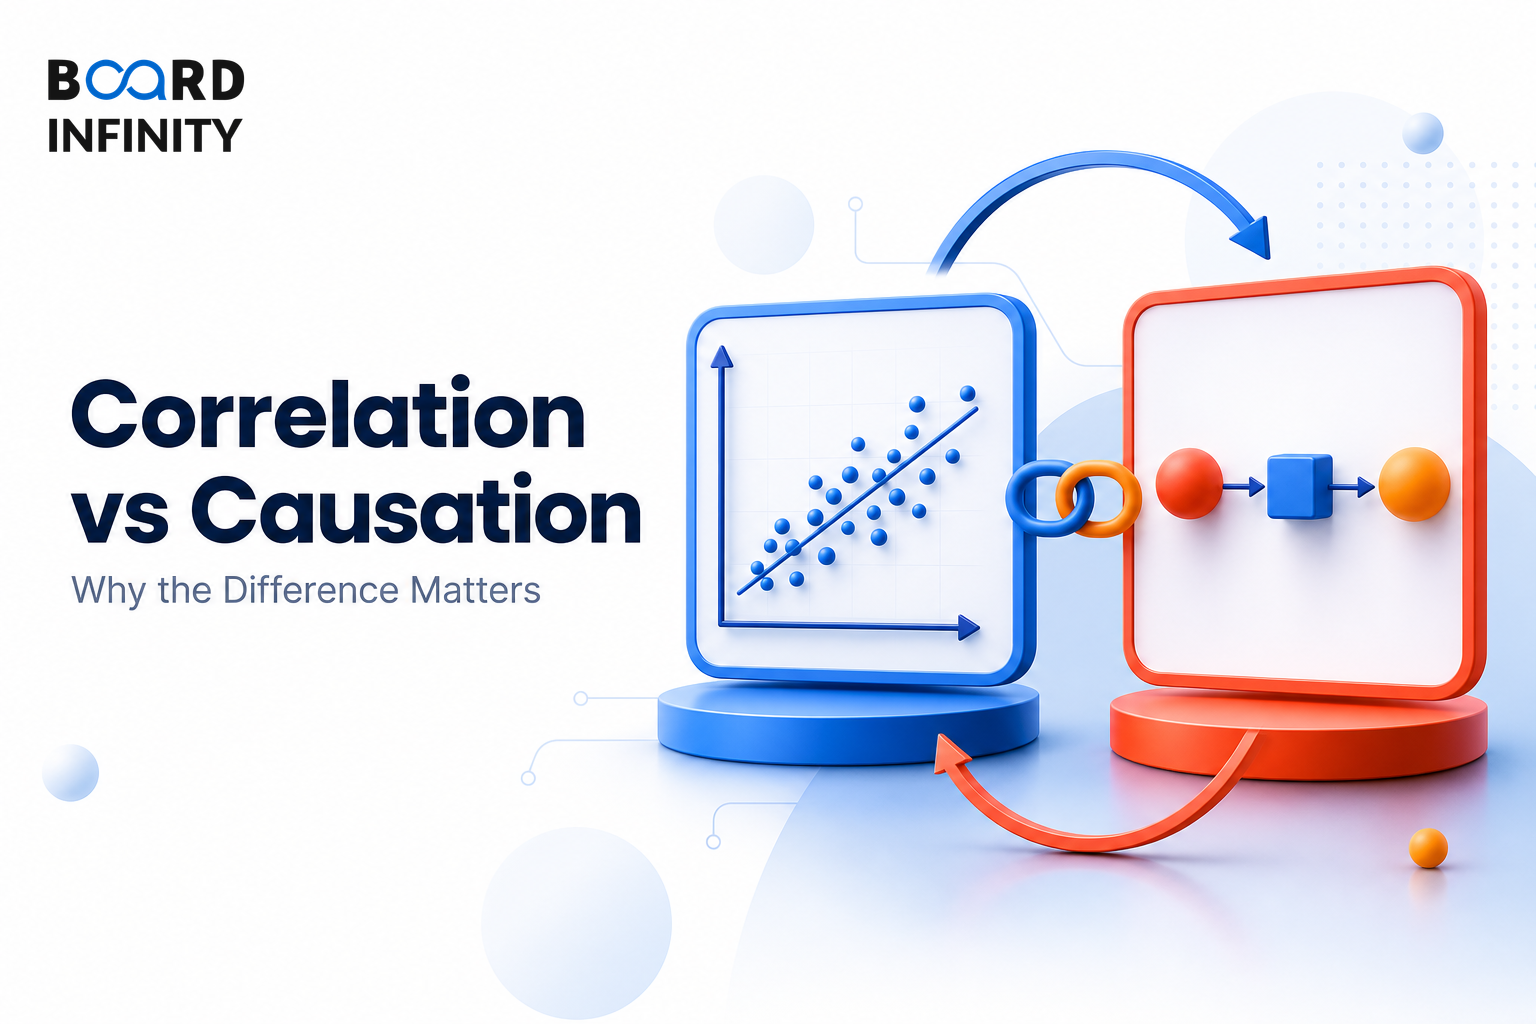
After non-parametric tests, the next interview trap is not choosing the wrong statistical test, but drawing the wrong business conclusion from a relationship in the data. Correlation vs causation is the #1 Analytics Mistake: Confusing correlation with causation. Always ask: "Is there a lurking (confounding) variable?"
- The #1 Analytics Mistake is confusing correlation with causation.
- Correlation means two variables move together, but one does not necessarily cause the other.
- Causation means X actually causes Y, proven through controlled experiment (A/B test) or causal inference methods.
- Classic example: Ice cream sales and drowning deaths are highly correlated (r ≈ 0.85), but ice cream does not cause drowning.
- The lurking variable is summer temperature, which drives both ice cream sales and drowning deaths.
- Before making a decision, check for Direct Causation, Reverse Causation, Confounding Variable, and Spurious Correlation.
- Never say "increasing ad spend CAUSES more sales" from correlation alone - you need an incrementality test or geo holdout.
The Big Picture
A strong relationship is only useful if you can rule out reverse causation, confounders, or coincidence. In interviews, the safest structure is to first describe what is observed, then test whether the relationship is causal before recommending action.
Correlation: Two variables move together. Causation: X actually causes Y, proven through controlled experiment (A/B test) or causal inference methods.
Swiggy orders and traffic accidents both peak on Friday evenings. Cause? Shared variable (Friday socialising). The strategic so what is simple: the relationship is real, but the causal link is not established.
Reading Correlation Coefficients
The correlation coefficient (r) indicates the strength and direction of a linear relationship. The interpretation changes sharply depending on whether r is close to +1.0, close to -1.0, or near zero.
Why Correlation Does Not Prove Causation
Classic example: Ice cream sales and drowning deaths are highly correlated (r ≈ 0.85) - but ice cream does not cause drowning. The lurking variable is summer temperature, which drives both.
For analysts, the job is to separate the relationship you observe from the mechanism you can defend. The same pattern can appear because A causes B, B causes A, a third variable drives both, or the relationship is random coincidence with no mechanism.
Indian Examples to Use in Interviews
Indian interview examples often test whether you can resist the temptation to convert a visible relationship into a causal claim. Use these examples to show that you can identify the likely alternative explanation.
- Correlation: Swiggy orders and traffic accidents both peak on Friday evenings. Cause? Shared variable (Friday socialising).
- Correlation: States with more doctors have higher cancer rates. Cause? Better diagnosis/reporting - not causation.
- Correlation: Students with more books at home score better in school. Cause? Socioeconomic status (lurking variable).
Worked Example - When a Real Correlation Leads to a Wrong Budget Decision
An FMCG company found strong correlation (r=0.87) between ice cream sales and marketing spend in cities. It doubled marketing budget in summer. Sales went up - but so did non-marketing cities at same rate.
Both ice cream sales and marketing ROI were caused by heat/summer, not each other. The correlation was real but the causal link was wrong. The outcome was wasted ₹3Cr in incremental spend.
The better approach: use difference-in-differences, matched controls, or natural experiments to establish causality. Never act on correlation alone for budget decisions.
Structuring a Correlation vs Causation Interview Answer
"Swiggy orders and traffic accidents both peak on Friday evenings. Does this mean Swiggy orders cause traffic accidents?"
The #1 way candidates get this wrong is saying "increasing ad spend CAUSES more sales" from correlation alone. You need an incrementality test or geo holdout.
Confusing correlation with causation is the #1 mistake in business analytics. It costs points because it ignores the possibility of reverse causation, a confounding variable, or random coincidence with no mechanism.
Conclusion
Correlation tells you that two variables move together; causation proves that one actually causes the other. In interviews and business decisions, always separate what you observe from what you can causally defend.