
Types of Data: Quantitative vs Qualitative Explained
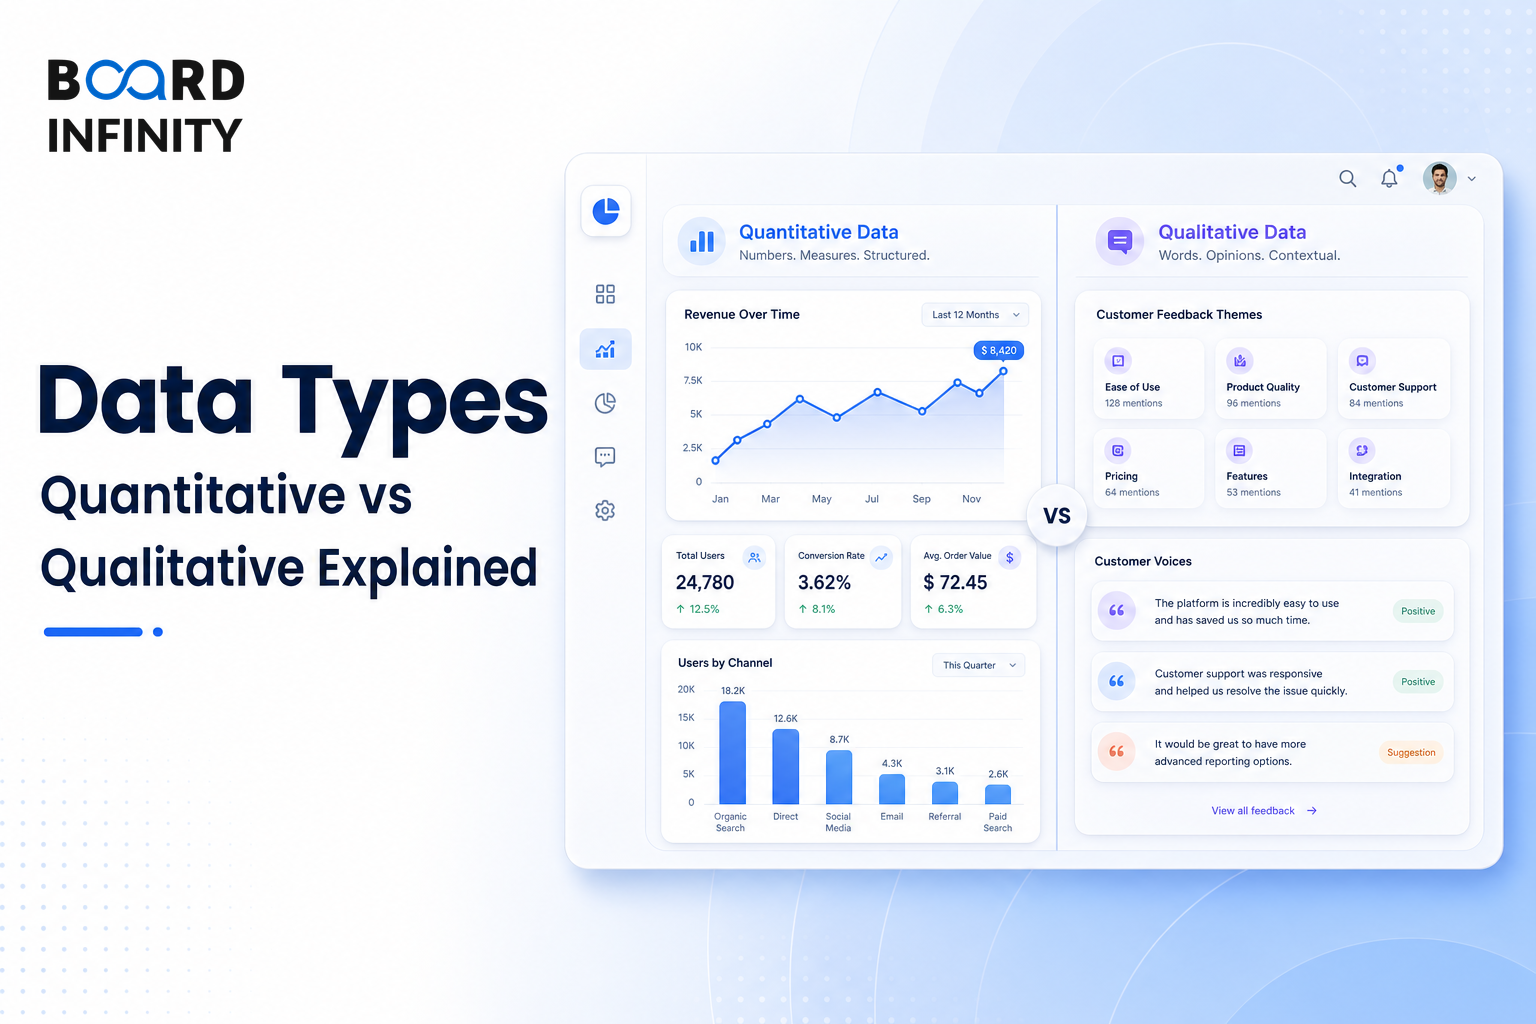
Before an analyst chooses a mean, median, Chi-square test, Spearman rank correlation, histogram, box plot, or bar chart, the first decision is the data type. Choosing the wrong analysis for the wrong data type is a critical analytical error. In interviews, this matters because the variable type determines the valid analysis method, statistical test, and chart choice.
- Data Type Hierarchy: All data is either Quantitative (Discrete or Continuous) or Qualitative (Nominal or Ordinal).
- Quantitative Discrete data means countable whole numbers, such as No. of orders per day (Swiggy).
- Quantitative Continuous data means measurable, infinite precision, such as Delivery time (minutes), Revenue (₹).
- Qualitative Nominal data means categories with no order, such as Payment method: UPI, Card, COD.
- Qualitative Ordinal data means categories with meaningful order, such as Customer satisfaction: 1-5 stars.
- Choosing the wrong analysis for the wrong data type is a critical analytical error.
The Big Picture: Data Type Hierarchy
Data Type Hierarchy: All data is either Quantitative (Discrete or Continuous) or Qualitative (Nominal or Ordinal). The hierarchy is useful because each sub-type points to suitable analysis and chart type.
Data Type Hierarchy: All data is either Quantitative (Discrete or Continuous) or Qualitative (Nominal or Ordinal).
Quantitative Data
Quantitative data appears in two sub-types: Discrete and Continuous. Discrete data uses countable whole numbers, while Continuous data is measurable with infinite precision.
For Quantitative Discrete data, the Indian example is No. of orders per day (Swiggy), with suitable analysis such as Mean, Mode, Poisson dist., and chart types such as Bar chart, Histogram. For Quantitative Continuous data, the Indian examples are Delivery time (minutes), Revenue (₹), with suitable analysis such as Mean, Median, Normal dist., and chart types such as Histogram, Box plot.
Qualitative Data
Qualitative data appears in two sub-types: Nominal and Ordinal. Nominal data has categories with no order, while Ordinal data has categories with meaningful order.
For Qualitative Nominal data, the Indian example is Payment method: UPI, Card, COD, with suitable analysis such as Mode, Chi-square test, Bar chart, and chart types such as Bar chart, Pie chart. For Qualitative Ordinal data, the Indian example is Customer satisfaction: 1-5 stars, with suitable analysis such as Median, Spearman rank correlation, and chart types such as Bar chart, Likert scale.
Structured vs Semi-Structured vs Unstructured Data
Data type also matters at the storage and analytics challenge level. Structured data has rows and columns with a fixed schema, Semi-Structured data has a flexible schema, key-value or hierarchical structure, and Unstructured data has no fixed schema.
Why the Data Type Decision Matters
Choosing the wrong analysis for the wrong data type is a critical analytical error. The same business context can lead to different analysis methods and chart choices depending on whether the variable is Discrete, Continuous, Nominal, or Ordinal.
No. of orders per day (Swiggy) is Quantitative Discrete, so Mean, Mode, Poisson dist., Bar chart, and Histogram are suitable. Payment method: UPI, Card, COD is Qualitative Nominal, so Mode, Chi-square test, Bar chart, Pie chart are suitable. Customer satisfaction: 1-5 stars is Qualitative Ordinal, so Median, Spearman rank correlation, Bar chart, and Likert scale are suitable.
Structuring a Types of Data Interview Answer
"How would you identify the type of data and choose the suitable analysis and chart type for Swiggy or Razorpay data?"
Always identify the type before choosing an analysis method. The strongest answer ties the variable type directly to suitable analysis and chart type.
The most frequent error is choosing the wrong analysis for the wrong data type. It costs points because Discrete, Continuous, Nominal, and Ordinal variables have different suitable analysis methods and chart types.
Conclusion
All data is either Quantitative or Qualitative, and each sub-type guides the suitable analysis, statistical test, chart type, storage pattern, and analytics challenge. In interviews, classify the variable first, then choose the method.