
E-Commerce careers in India: what the numbers say about jobs, growth and where to start
E-commerce is one of the few sectors in India that will hand a 22-year-old a real number to move within months of joining - a city, a category, a warehouse, or a screen that millions of people see. That is the attraction. What almost nobody tells you before you apply is which part of the sector is actually growing, what each job is measured on, and which skills are genuinely scarce right now.
This report answers those three questions using numbers that can be checked. Every figure below comes from a company filing, a published industry study or a government notification, and every figure states the period it covers. Data is current as of August 2026.
1. Why look at this sector at all
Four things make Indian e-commerce worth a serious look, and one thing should give you pause.
It is still small, which is the point. E-retail was about 1.6% of India’s GDP in 2025. In Indonesia the figure is 4% to 4.5%, and in China it is 13% to 14%. A sector that has already been built out does not hire the way one with that much headroom does.
It gives responsibility absurdly early. Because almost everything is measured daily, a new joiner can be handed a city, a category or a funnel and judged on it within a quarter. Very few industries can hand over a defined P&L that fast.
The work is genuinely quantitative. Nearly every decision is an experiment with a number attached. If you like reading data and acting on it, the sector rewards that more directly than most.
It is hiring in places other sectors are not. Roughly half of all incremental e-retail orders in 2025 came from Tier 2 and smaller cities, and the operations jobs follow the orders. These are not three-metro careers.
And the caution: growth is spread very unevenly. In the June 2026 quarter the fastest-growing listed player grew revenue 48% while the slowest grew 11%. Joining the wrong part of the right sector is a real risk, and Section 3 is about exactly that.
It is also worth being clear about what this sector is not. It is not, for most people, a desk job with predictable hours. Operations roles run to the rhythm of the business, which means early mornings before a store opens and the busiest weeks of the year falling during festive sales. It is not uniformly well paid at entry level either - a city operations role and a product role at the same company can be a long way apart. And it is not stable in the way a bank or an FMCG company is: teams get restructured, products get shut down, and the company you join may look materially different in three years. Some people find that energising and some find it exhausting, and it is worth knowing which you are before you sign.
2. How big it is, and how fast it is really growing
You will see a very large number quoted everywhere: that Indian e-commerce will be worth US$345 billion by 2030, or US$550 billion by 2035. Those come from IBEF, and they are forecasts. They are worth knowing. They are not measurements, and they cover a wider definition than most people realise.
What has actually been measured is smaller and more useful. E-retail - physical goods bought online, excluding travel, tickets and services - reached $65–66 billion in gross merchandise value in calendar 2025, growing 19–21%. That figure comes from How India Shops Online 2026, published by Bain & Company with Flipkart, and it is the number people inside the sector actually use.
Why this matters to you and not just to analysts. If you walk into an interview quoting a 2030 forecast, anyone who works in the sector knows instantly that you have read a headline rather than a result. The useful habit is the opposite: name the period, name the source, and say whether the number was measured or projected. That single discipline separates people who have read about the sector from people who could work in it.
GMV is gross merchandise value - the rupee value of everything sold through a platform, before the platform’s cut. Revenue is what the platform itself keeps. A marketplace with ₹100 of GMV might book ₹10 of revenue. Mixing the two up is the most common mistake in e-commerce interviews.
The growth did not arrive evenly. E-retail grew about 14% in the first half of 2025 and 22–24% in the second, helped by GST cuts on several categories, income tax relief and easing inflation. Private consumption across the economy rose 10.5% in 2025, up from about 8% in the preceding three years. That momentum carried into early 2026, with growth estimated at 23–25% in the first quarter.
The headroom argument is worth understanding properly, because it is what every hiring plan in the sector rests on. About 30% of India’s internet users currently shop online. In the United States the figure is 74%, and in China 92%. In Bengaluru and Hyderabad, more than seven in ten internet users already shop online - so the ceiling is not cultural. It is a matter of reach, trust and price, and all three are being worked on.
There is a second lever alongside more shoppers, which is more spending per shopper. India’s GDP per capita is expected to pass US$4,000 by 2030, a level that has historically marked the point where discretionary spending accelerates. The pattern is already visible domestically: in the top metros, where GDP per capita is around US$8,500, people spend roughly 65% more online than the national average. So the sector is betting on two things compounding at once - more people shopping, and each of them spending more.
One caveat on all of this, and it applies to every market-size number you will ever be given. E-retail excludes travel bookings, movie tickets, ride-hailing, food delivery and financial services. Those are large businesses, and some of the companies in this report operate in them, but they are not counted in the $65–66 billion. When a number looks surprisingly large or small, the definition is almost always the reason. Ask what is inside it before you argue about it.
3. Who leads, and what that tells you
This is the most useful table in the report if you are choosing an employer. Every figure covers the same three months - the quarter ended 30 June 2026, which companies call Q1 FY27 - because comparing one company’s annual figure with another’s quarter is the fastest way to reach a wrong conclusion.
| Company | Revenue, Q1 FY27 | Growth | Order-value metric | What it signals for someone joining |
|---|---|---|---|---|
| Eternal (Zomato, Blinkit) | ₹20,648 cr | 173% | B2C NOV ₹31,120 cr, +54% | The largest listed platform by revenue. Quick commerce is now bigger than food delivery inside it, so most new roles sit on the Blinkit side |
| Meesho | ₹3,713 cr | 48% | NMV ₹11,614 cr, +34% | Value commerce, zero-commission model, deepest Tier 2+ reach. Listed in December 2025, so its numbers are now public |
| Delhivery | ₹2,931 cr | 28% | Logistics, no order-value metric | The delivery layer the others rent. A supply-chain and network-design employer rather than a consumer one |
| Nykaa (FSN E-Commerce) | ₹2,782 cr | 29% | GMV ₹5,590 cr, +34% | Vertical specialist in beauty. The clearest example of a profitable category-led model, with EBITDA margin at 8.5% |
| Swiggy | ₹7,112 cr | 34% | Food GOV ₹9,490 cr; Instamart GOV ₹7,907 cr | The number two in both food delivery and quick commerce. Instamart hit contribution break-even in May 2026 |
| FirstCry (Brainbees) | ₹2,106 cr | 13% | GMV ₹2,807 cr, +12% | Omnichannel specialist: online plus physical stores. Slowest growth here, which is itself worth understanding |
| IndiaMART | ₹414 cr | 11% | B2B marketplace, no GMV metric | B2B, subscription-funded, 35% EBITDA margin. A very different economic model from consumer e-commerce |
Every figure in that table comes from the company’s own filing. You can check each one yourself: Eternal, Swiggy, Meesho, Nykaa, Delhivery, FirstCry and IndiaMART all publish quarterly results and investor presentations free of charge. Reading one of them end to end is the single highest-value hour of preparation available to you, and almost nobody does it.
Two patterns are worth carrying into any conversation about this sector. Scale and growth have separated - the largest listed player is not the fastest-growing one, and the fastest-growing one is not yet the most profitable. And the business models are genuinely different: IndiaMART sells subscriptions to businesses at a 35% EBITDA margin, Delhivery moves parcels for everyone else, and Nykaa sells beauty products it often owns. Calling all of them “e-commerce” hides more than it reveals.
It is also worth noticing who is missing from that table. Amazon India and Flipkart are not on it, and between them they account for a very large share of Indian e-retail. Neither publishes quarterly Indian results the way a listed Indian company must: Amazon reports India inside a global segment, and Flipkart is owned by Walmart. Zepto, the third large quick commerce player, is still private. This is a genuine limitation of any comparison like this one, and the honest way to handle it is to say so rather than to fill the gap with estimates. It also means that if you want verified numbers on your prospective employer, a listed company is simply an easier place to do your homework.
“Which part of the business would this role sit in, and what was its growth and its contribution margin last quarter?” Inside one company, a mature category and a new one can be growing at 11% and 48% respectively. The answer tells you whether you will spend two years defending something or building something.
4. Where the growth actually sits
The sector’s growth is not spread evenly across customers, cities or categories, and knowing the split is most of what separates a good answer from a vague one.
Tier 2 and smaller cities contributed about half of all incremental e-retail orders in 2025, despite only 25–30% of their internet users shopping online, against 45–50% in metros. Gen Z - people born between 1997 and 2012 - now make up 40–45% of online shoppers and close to half of incremental orders. Both groups behave differently from the metro shoppers platforms were originally designed for: more price-sensitive, more video-led in how they discover products, and more likely to pay with UPI than a card.
| Where growth is coming from | The evidence | Period | What it means for a career |
|---|---|---|---|
| Tier 2 and smaller cities | About 50% of incremental e-retail orders | Calendar 2025 | City and regional operations roles are being created outside the metros |
| Gen Z shoppers | 40-45% of all online shoppers; about half of incremental orders | Calendar 2025 | Content, creator and video-led growth roles |
| Quick commerce | GMV doubled annually since 2023 to $10-11 billion | Calendar 2025 | The single largest source of new entry-level jobs in the sector |
| Online grocery | E-grocery penetration up fivefold since 2020, to about 1.5% of grocery | Calendar 2025 | Category and sourcing roles in the largest retail category of all |
| Retail media | E-retail ads are about 25% of Indian digital ad spend | Calendar 2025 | Ad platform, seller marketing and monetisation roles |
| Seller ecosystem | Meesho alone reports 1.04 million annual transacting sellers | Quarter ended June 2026 | Seller growth and seller support roles at scale |
The pattern across those rows is consistent: the growth is in making the sector cheaper, faster and available further out, rather than in selling more to the people who already shop online. That is why so many of the new roles are operational rather than glamorous.
5. How an order reaches a customer, and the jobs that do it
Most people picture e-commerce as an app. The app is the smallest part of it. An order passes through six steps, and almost every entry-level role in the sector sits at one of them - so it is worth understanding the chain before you pick a job on it.
Four terms run through every conversation in this sector, and being loose with them is an instant tell. GMV is the value of goods sold. Take rate is the percentage of that the platform keeps. Contribution margin is what is left from an order after the costs that vary with that order - delivery, packing, payment fees, discounts. Unit economics is the whole question of whether a single order makes or loses money once you include everything.
The structural thing to understand is that Indian marketplaces mostly do not own what they sell. Foreign investment rules permit 100% overseas ownership of a marketplace that connects buyers and sellers, but not of an inventory-led model where the platform owns the stock. That single rule shapes the org chart: it is why platforms employ large seller-facing teams rather than large buying teams, and why “category manager” means something different here than in a supermarket chain.
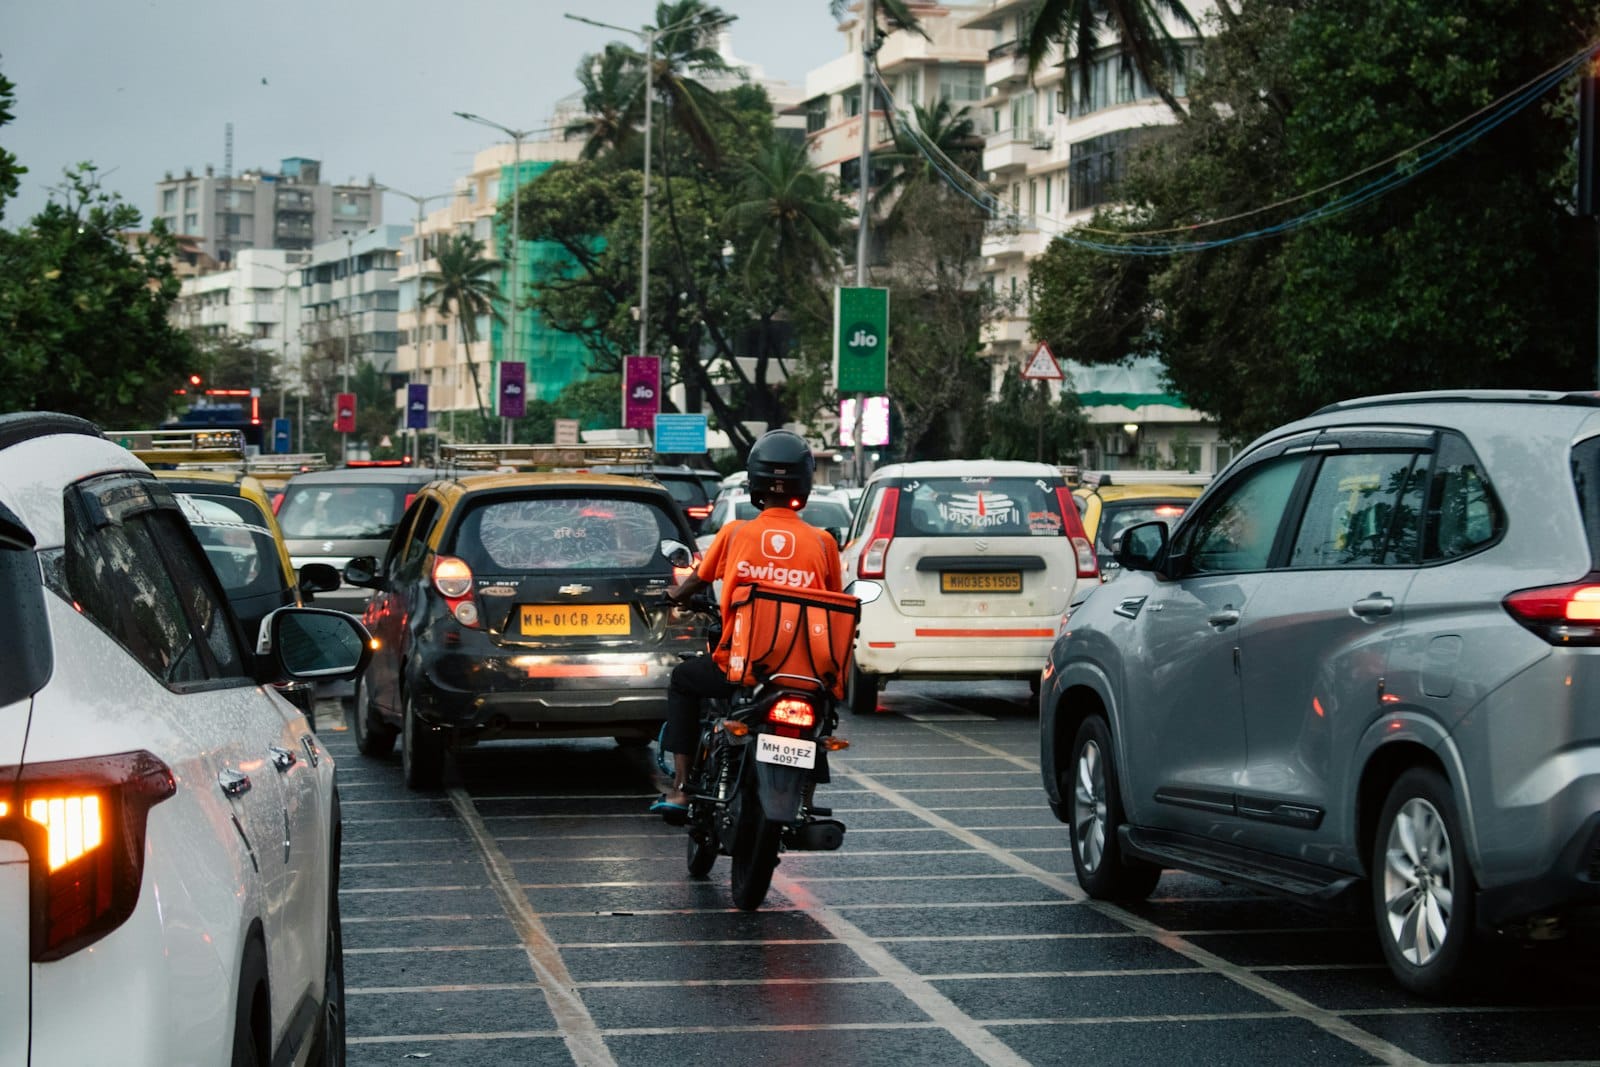
The delivery layer is worth calling out separately, because it is where the sheer scale of employment sits. Swiggy alone reports working with over 6.5 lakh delivery partners and over 2.7 lakh restaurants across 720-plus cities. Most of those delivery partners are gig workers rather than employees, which is itself one of the sector’s live public debates and something you should expect to be asked about.
The seller side is equally large and much less visible. Meesho reports 1.04 million annual transacting sellers and 274 million annual transacting users for the quarter ended June 2026. Across the sector the seller base has roughly tripled in five years, with a growing share coming from Tier 2 and smaller cities. Every one of those sellers needs onboarding, catalogue help, pricing advice and someone to call when an order goes wrong - which is why seller growth and seller support are among the largest entry-level teams at any marketplace, and among the least talked about on campus.
Returns deserve a paragraph of their own, because students almost never think about them and interviewers almost always do. When a customer sends something back, the platform pays to collect it, inspect it, restock it or write it off, and refunds the money - often having already paid the delivery cost on the way out. In categories like apparel the return rate can be a large fraction of orders, which is why fashion is a harder business online than electronics despite looking more attractive on gross margin. If you are asked why a category is unprofitable, returns are usually somewhere in the answer.
6. The quick commerce shift, and the skill it created
This is the part of the sector that has changed fastest, and the part where employers are shortest of people.
Quick commerce - groceries and essentials delivered in roughly ten minutes from a small local warehouse - reached $10–11 billion of GMV in 2025, having doubled every year since 2023. It is still only about a sixth of e-retail. But Bain and Flipkart project it will supply 45–50% of all the growth e-retail adds between now and 2030, which is why it dominates hiring far out of proportion to its current size.
The physical footprint is the clearest signal. Blinkit ended June 2026 with 2,443 dark stores, adding 200 in that quarter alone. Swiggy’s Instamart ran 1,171 stores across 131 cities, covering 4.9 million square feet. Across the sector there are now more than 7,000 micro-fulfilment centres. Every one of them needs a store manager, an inventory planner and a shift roster, and those jobs did not exist five years ago.
Eternal reports Blinkit in net order value, which is after discounts. Swiggy reports Instamart in gross order value, which is before them. The two are not the same measure, so putting them side by side without saying so overstates the gap. Before you compare any two platforms, check that the metric and the period match.
Quick commerce also behaves differently from the rest of e-commerce in ways that change the job. Shoppers arrive knowing what they want: a typical session lasts under five minutes against more than ten minutes on a traditional marketplace, and the visit-to-order conversion rate is around eight times higher. Baskets are smaller and more frequent, which means the whole operation is tuned for speed and availability rather than for browsing and discovery. A category manager in quick commerce spends their time on which 3,000 items fit in a small store and never run out, not on which 300,000 items could theoretically be listed.
There is one more structural point. Quick commerce is genuinely expanding the market rather than only taking share from it. E-grocery penetration has risen roughly fivefold since 2020 and now stands at about 1.5% of the overall grocery market, reaching 6–7% in metros. Groceries are the single largest retail category in India and the least penetrated online, which is exactly why so much capital and hiring has gone into a format that mostly sells household essentials - they are 85–90% of quick commerce GMV.
The career point. Traditional marketplace e-commerce still carries most of the volume, so that is where most roles are and where the core craft is learned. But quick commerce is where employers are hiring fastest and where fewest people have real experience. If you can run a dark store or a platform account - assortment, availability, promotion economics, rider throughput - you are genuinely scarce right now. That window is open, and it will not stay open indefinitely: the people being hired into it today are the ones who will be the experienced hires in three years.
7. How the money is made, and what you will be measured on
Whatever role you take, your work will be judged by its effect on one of a small number of lines. Knowing which line your job moves is the difference between doing tasks and running a business.
A marketplace earns a take rate on each order, plus advertising revenue from sellers paying for visibility. Against that it pays for delivery, warehousing, payment processing, returns and discounts. The gap is the contribution margin, and in quick commerce it has been negative for most of the industry’s life.
That chart is the single most important one in the report. Blinkit crossed into positive adjusted EBITDA in the June 2025 quarter and has improved for five quarters running, reaching ₹102 crore of profit on a 0.6% margin in June 2026 - against a ₹162 crore loss a year earlier. Instamart is not there yet: it lost ₹778 crore in the June 2026 quarter, though it reached contribution break-even in May 2026 and its adjusted EBITDA margin improved from -10.9% to -9.8% in three months.
| Company or business | What it earns on | Margin, Q1 FY27 | Why it sits there |
|---|---|---|---|
| IndiaMART | Subscriptions from businesses | 35% EBITDA margin | No delivery, no inventory, no discounting. The purest software economics here |
| Nykaa | Product margin plus retail media | 8.5% EBITDA margin | A vertical specialist that owns much of its stock and sells a high-margin category |
| Eternal food delivery (Zomato) | Commission and delivery fees | 5.6% of net order value | A mature two-sided marketplace that has stopped subsidising growth |
| Delhivery | Per-parcel logistics fees | 5.3% EBITDA margin | An asset-heavy network business where scale and route density decide everything |
| Swiggy food delivery | Commission and delivery fees | 3.1% of gross order value | The same model as Zomato, at smaller scale and therefore thinner margin |
| Blinkit | Product margin, fees and ads | 0.6% of net order value | Only just profitable, after five straight quarters of improvement |
| Swiggy Instamart | Product margin, fees and ads | -9.8% of gross order value | Still investing heavily in stores and assortment to catch up |
Two lines deserve precision because they shape day-to-day work. Advertising is the fastest-growing and highest-margin revenue line on almost every platform - e-retail ads were roughly 25% of all Indian digital ad spend in 2025 - which is why retail media teams have expanded so quickly. And discounting is netted off revenue rather than shown as a cost, so a platform buying growth with coupons looks as though it has weak pricing rather than high spending. If your role touches promotions, that is the number you are moving.
The thing to take from that table is that the word “e-commerce” covers at least four different economic models. A subscription marketplace like IndiaMART has almost no variable cost per transaction, which is why it earns a 35% margin. A vertical retailer like Nykaa owns stock and earns a product margin, so it looks more like a retailer than a platform. A logistics network like Delhivery earns a small fee on enormous volume and lives or dies on route density. And a quick commerce platform carries inventory, real estate and a delivery fleet all at once, which is why it took the longest to reach profit. Knowing which of the four you are interviewing with tells you what the job will actually be about.
One habit worth building now: whenever you see a margin quoted, ask what it is a percentage of. Blinkit’s 0.6% is a share of net order value. Nykaa’s 8.5% is a share of revenue. Those denominators are wildly different sizes, so the two numbers are not comparable even though both are called a margin. Getting this right in an interview is a strong signal; getting it wrong is a fast way to lose the room.
8. What is being built, and where
Announced capacity is the closest thing to a hiring forecast this sector publishes. Warehouses being fitted out now need people to run them within a year.
The build-out is happening on two very different scales at once. Large fulfilment centres sit on city outskirts and serve a whole region for scheduled delivery; they are network-design and inventory problems. Dark stores and micro-fulfilment centres sit inside neighbourhoods and serve a two-kilometre radius in minutes; they are throughput and availability problems. More than 7,000 micro-fulfilment centres are now operating, and two-thirds of new additions have been concentrated in the top ten cities.
That concentration is the thing to watch. Quick commerce economics have been proven in dense metros; they are not yet proven in smaller cities, where order density is lower and the same ten-minute promise costs more to keep. Whether that changes is the open question of the next three years, and it decides how many of these jobs exist outside the top ten cities.
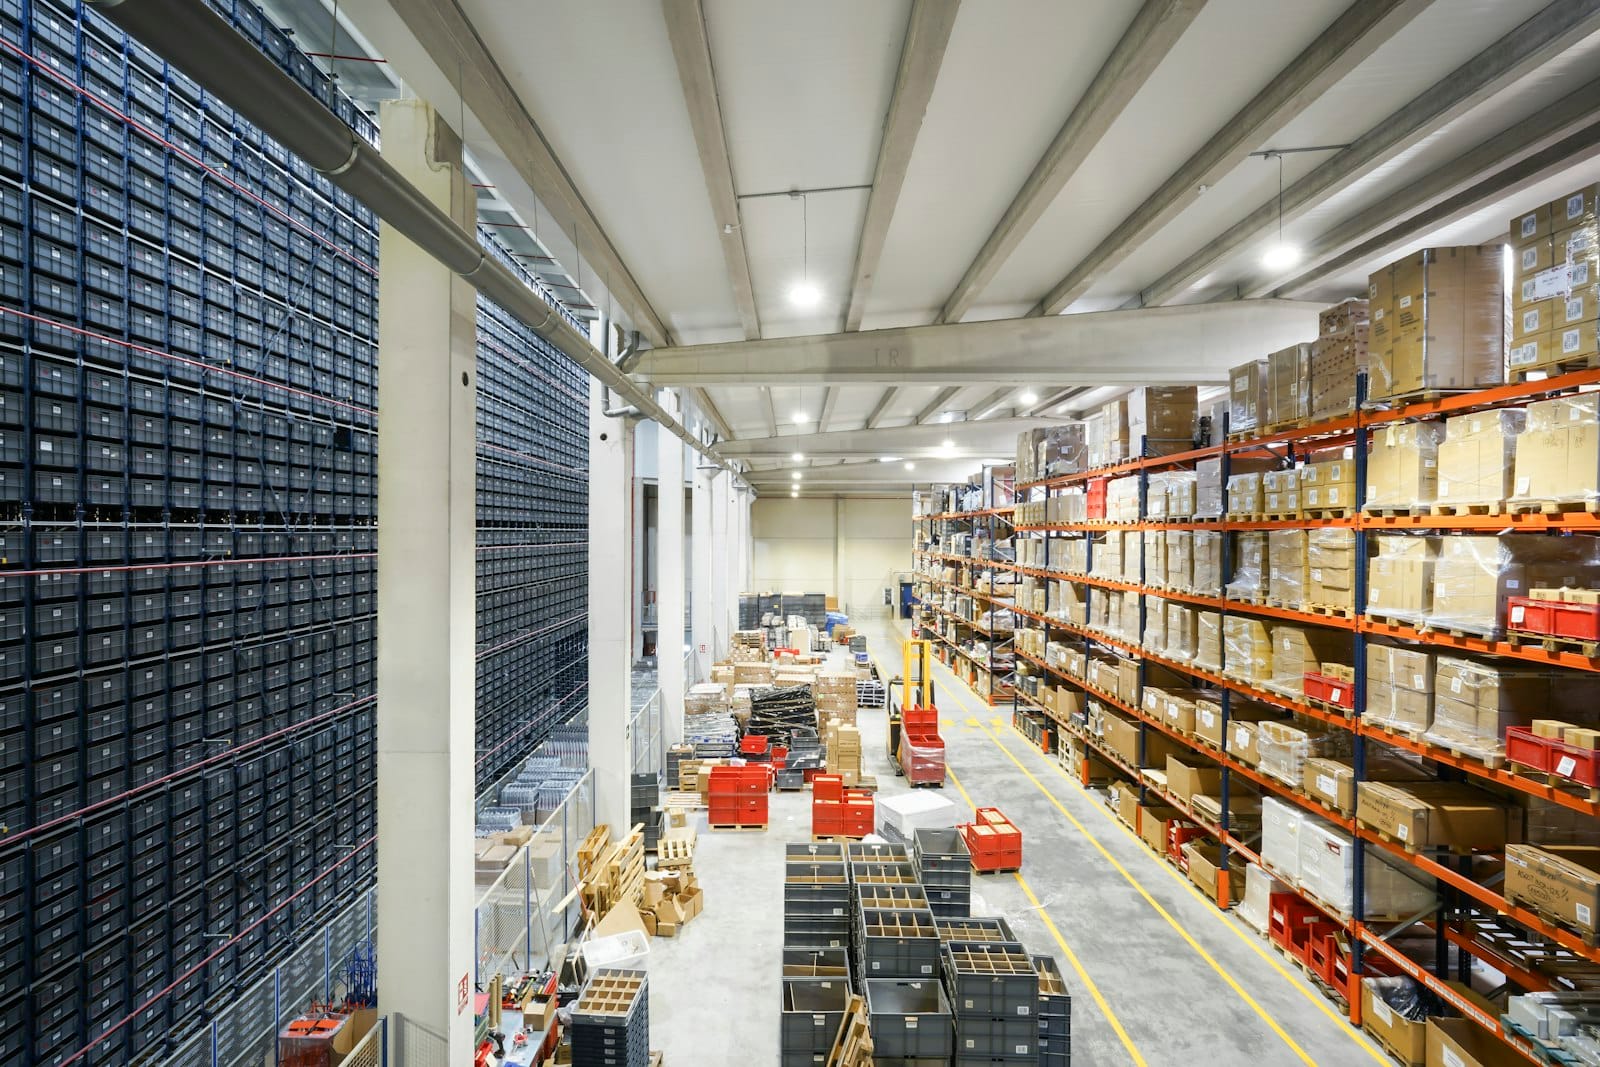
For anyone considering a supply chain or operations role, this split is the most useful thing to understand about the sector. The two formats need genuinely different people. A fulfilment centre is a planning problem: what to stock, where to place it, how to route it, measured over weeks. A dark store is an execution problem: what is on the shelf right now, how fast it is picked, whether a rider is free, measured over minutes. Students who say “I want to work in supply chain” without knowing which of the two they mean tend to interview poorly for both.
The warehouse network question is also one of the most common case study prompts in this sector, precisely because it has no clean answer. Put stock close to customers and you deliver faster but hold more inventory in more places. Centralise it and you hold less but deliver slower and pay more freight. Every platform in this report is somewhere on that trade-off, and where they sit tells you a lot about what they are optimising for.
Alongside the private build-out sits a public one. ONDC, the Open Network for Digital Commerce, is a government-backed attempt to unbundle e-commerce: instead of a buyer and seller both having to be inside the same app, any buyer app can reach any seller app over a shared protocol. It went from 0.2 million transactions in FY23 to 218 million in FY26, crossed 500 million cumulative transactions in July 2026, and was running around 10 million transactions a month by June 2026. Whether it becomes the UPI of commerce or stays a niche is genuinely undecided - but understanding what it is trying to do is now table stakes in interviews.
9. The rules you will work inside
E-commerce is one of the more heavily regulated parts of the Indian consumer economy, and the rules directly shape what your job is allowed to do.
Foreign investment. Under the consolidated FDI policy, 100% foreign investment is allowed under the automatic route in the marketplace model, where the platform is a facilitator between buyer and seller. It is not permitted in the inventory model, where the platform owns the goods. Press Note 2 of 2018, issued on 26 December 2018 and effective from 1 February 2019, tightened this considerably. This is the single rule that explains most of how Indian e-commerce is structured.
Consumer protection. The Consumer Protection (E-Commerce) Rules, 2020, in force since 23 July 2020, require platforms to display country of origin, appoint a grievance officer, and not manipulate prices or misrepresent goods.
Dark patterns. This is the rule most relevant to anyone going into product or design. In November 2023 the Central Consumer Protection Authority notified guidelines identifying and prohibiting 13 specific deceptive design practices - including false urgency, basket sneaking, drip pricing and subscription traps. On 5 June 2025 the CCPA directed all platforms to complete a self-audit within three months, and by 20 November 2025 26 platforms had declared compliance. Enforcement is real: Zepto was fined ₹7 lakh in December 2025 over hidden checkout charges.
Data protection. The Digital Personal Data Protection Act, 2023 governs how platforms collect and use personal data, and the DPDP Rules, 2025 were notified on 13 November 2025. Enforcement is phased: the Data Protection Board was established immediately, consent-manager obligations take effect from 13 November 2026, and the core consent, privacy-notice and security requirements from 13 May 2027. E-commerce companies hold an unusual amount of personal data - what you bought, when, where you live, how you pay - so this is one of the larger compliance programmes running inside them right now. For a student, the practical point is that “personalisation” and “data minimisation” now pull against each other inside every product team, and being able to discuss that tension sensibly marks you out as someone who has thought about the job rather than just the app.
Read together, the direction of travel is clear enough: the rules are moving from what you sell towards how you present it and what you do with the data. That is a shift from a purely commercial compliance burden to a design and engineering one, and it is why policy literacy has quietly become useful in roles that never used to need it.
Learn the 13 named dark patterns before your interview. False urgency, basket sneaking, confirm shaming, forced action, subscription trap, interface interference, bait and switch, drip pricing, disguised advertisements, nagging, trick wording, SaaS billing and rogue malware. Being able to name them, and say what you would build instead, is a genuinely differentiating answer.
10. What could go wrong
Read this as a list of things to watch rather than reasons to stay away. Most of them are about economics and regulation rather than a collapse in demand.
| Risk | Likelihood | Impact | What it would mean for your role |
|---|---|---|---|
| Quick commerce stays loss-making outside metros | Medium | High | Expansion slows and store-opening roles shrink. Metro roles stay funded longest |
| Funding tightens for the unprofitable players | Medium | High | Hiring freezes at the weaker platforms first. Profitable businesses keep hiring |
| Tighter e-commerce or FDI regulation | Medium | Medium | Compliance, legal and policy teams expand; some seller programmes get redesigned |
| Gig worker classification changes | Medium | Medium | Delivery cost per order rises materially, and operations roles get harder briefs |
| Enforcement against dark patterns widens | High | Low to medium | Product and design work gets more constrained, and more interesting |
| Consolidation among quick commerce players | Medium | Medium | Fewer employers, larger ones. Integration and category roles open up |
Two of those rows deserve expanding, because they are the ones most likely to affect a career started in 2026. The first is whether quick commerce works outside the top ten cities. Two-thirds of new micro-fulfilment centres have gone into those ten cities, which tells you where the economics are proven. In a smaller city the same ten-minute promise has to be kept with fewer orders per store, and nobody has yet demonstrated at scale that the maths holds. If it does, this sector becomes one of the largest employers of graduates in the country. If it does not, quick commerce stays a metro business and the hiring flattens.
The second is gig worker classification. Most delivery partners are currently engaged as independent contractors rather than employees. If that changes - through legislation, litigation or social security rules - the cost of every single order rises, and it rises most for the businesses with the thinnest margins. That is a live policy debate rather than a settled one, and having a considered view on it is a genuinely good answer to “what is the biggest risk facing this industry?”
None of these is a reason to avoid the sector. They are the reason unit economics literacy is currently a hireable skill, and the reason the profitable parts of each business are the safest place to sit.
11. One company’s year, in detail
Adjusted revenue grew 173% year on year to ₹20,648 crore - but on a like-for-like basis the growth was 66%. Both numbers are true. Understanding why they differ is the whole lesson of this section.
Eternal is the listed parent of Zomato, Blinkit, District and Hyperpure. In the June 2026 quarter it reported four things that are worth separating out, because together they explain how a modern e-commerce group actually works.
What it establishes. A single company can contain a mature profitable business, a newly profitable one, and two loss-making experiments at the same time - growing at 20%, 86% and 60% respectively. “I want to work at Eternal” is not a career plan. “I want to work on Blinkit’s category team” is.
12. Latest developments
The sector restates itself every quarter. These are the developments that have actually moved something, most recent first.
| Date | Development | Why it matters to you |
|---|---|---|
| July 2026 | Eternal reports Blinkit net order value of ₹17,132 crore, overtaking food delivery; 2,443 dark stores | Quick commerce is now the larger business inside India's biggest listed platform |
| July 2026 | Swiggy reports Instamart reached contribution break-even in May 2026 | The second player proving the model can work changes how investors fund the sector |
| July 2026 | ONDC crosses 500 million cumulative transactions | The open-network experiment is no longer a pilot |
| June 2026 | Amazon, Eternal, Meesho, Swiggy and Zepto launch the Digital Commerce Coalition | An industry body forming usually means regulation is coming. Policy roles grow from here |
| April 2026 | Bain and Flipkart report e-retail GMV of $65-66 billion for 2025, up 19-21% | The benchmark number for the sector, and the one to quote in interviews |
| December 2025 | Meesho lists on the NSE and BSE | A major private platform's numbers become public and checkable |
| December 2025 | CCPA fines Zepto ₹7 lakh over hidden checkout charges | Dark pattern enforcement moved from advisory to penalty |
| November 2025 | 26 platforms declare dark-pattern self-audit compliance | Design and product work now carries a documented compliance obligation |
| November 2025 | Digital Personal Data Protection Rules notified, with phased enforcement to May 2027 | A multi-year compliance programme inside every platform, touching product and engineering |
| June 2025 | CCPA directs all platforms to self-audit for dark patterns within three months | The starting gun for the compliance wave above |
Read one quarterly shareholder letter in full each month, rotating through Eternal, Swiggy, Meesho, Nykaa and Delhivery. They are free on the investor relations pages linked throughout this report. Note two things each time: the growth rate of the fastest segment, and one sentence of management commentary on contribution margin. Twenty minutes a month keeps you genuinely current.
13. The jobs themselves
The sector hires into a small number of well-defined tracks. The promise is real responsibility early, and so is its cost: the first year is more operational, more repetitive and more spreadsheet-heavy than most people expect.
One honest caveat before the tables below. Programme names, intake sizes and eligibility change every year, and no public source tracks them reliably. Treat everything here as a starting point for your own checking rather than a vacancy list, and confirm against each company’s own careers page in the season you are applying. What does not change year to year is the shape of the work, which is what the next three tables describe.
It is also worth knowing that this sector hires unusually heavily outside the campus calendar. Operations, category and analytics teams grow when the business grows, not in September, and festive season staffing pushes a further wave of hiring every autumn - staffing firms expected seasonal hiring to rise 15–20% in 2026, with Tier 2 and Tier 3 cities accounting for roughly 45% of that demand. If you miss the campus process, the door is genuinely not closed.
What each function actually does
| Function | What the first year actually involves | What it selects for |
|---|---|---|
| Category management | Owning a slice of the catalogue. Selection gaps, pricing, seller negotiations, promotion planning, weekly growth reviews | Commercial judgement, negotiation, comfort with large spreadsheets |
| City or dark store operations | Owning a location's numbers. Availability, delivery times, rider supply, shrinkage, shift planning | Resilience, pace, willingness to be on the ground early and late |
| Supply chain and planning | Forecasting demand, placing inventory, designing routes. Fill rate, inventory days, cost per shipment | Process discipline and quantitative rigour |
| Product management | Owning one screen or flow. Writing specs, running experiments, reading funnels | Structured thinking, user empathy, tolerance for ambiguity |
| Business analytics | Turning platform data into decisions. Cohorts, funnels, pricing tests, dashboards | SQL, statistical care, the instinct to question a number |
| Seller growth | Recruiting and growing sellers. Onboarding, catalogue quality, seller economics | Relationship building plus commercial numeracy |
| Retail media and marketing | Selling and running ads on the platform. Campaign performance, ROAS, placement economics | Analytical marketing, comfort with auctions and bidding |
What the first eighteen months look like
The skills that actually get you hired
Three skills come up in almost every e-commerce job description, and all three can be learned before you have a job.
Being able to query data yourself. Almost every decision here starts with a number somebody had to pull. SQL is the common language for that, and the bar for being useful is lower than most students assume - joins, group-bys and window functions will cover the large majority of day-one work. Being the person who can answer their own question, rather than queueing behind an analyst, changes how quickly you are trusted.
Reading a funnel and a cohort. A funnel tells you where people drop out between opening an app and paying. A cohort tells you whether the people who bought in January are still buying in June. Growth that looks excellent in a funnel can be terrible in a cohort, because you are buying new customers to replace ones you lost. Knowing where these metrics mislead is more valuable than knowing how to calculate them.
Designing a test. Most product and pricing changes in this sector are settled by experiment rather than by argument. Understanding what a control group is, why sample size matters and how to avoid calling a result early is a genuine differentiator in a product or analytics interview, and it is entirely learnable from public material.
Beyond those three, what employers consistently say they are short of is judgement about unit economics - people who can look at an order and say where the money goes. That is the scarce skill referenced throughout this report, and it is why Section 7 is the section worth rereading.
Operations or product
The question students most want answered, and rarely get straight.
| Operations and category | Product and analytics | |
|---|---|---|
| What you own | A city, a warehouse or a category with a target | A screen, a funnel or a model |
| What you are judged on | Availability, delivery time, growth, contribution margin | Conversion, retention, experiment outcomes |
| Who you spend the day with | Store teams, sellers, delivery partners, finance | Engineers, designers, analysts, business teams |
| How fast feedback arrives | Daily. You know by evening whether the day worked | Weeks. Experiments need time to reach significance |
| What it builds | Execution, negotiation, commercial instinct, resilience | Structured thinking, technical fluency, judgement under ambiguity |
| Where it leads | City lead, regional head, category head, business head | Senior product manager, head of product, head of growth |
Neither is better. Operations teaches you how the sector actually works, and product teaches you how to decide what it should do. People who did operations first tend to be stronger at product than the reverse, because they have seen what the system can and cannot do. The honest difference is pace: operations gives you daily feedback, product gives you fewer and larger decisions.
Compensation numbers for Indian e-commerce roles on aggregator sites are largely unsourced and frequently wrong by a wide margin, and they vary enormously between a city operations role and a product role at the same company. This report deliberately does not publish a table of them. The reliable sources are your own institution’s audited placement report and people one or two years ahead of you in the same function.
14. The numbers to learn, and what to do next
Eight terms carry specific meanings in this sector and are used loosely almost everywhere else. Learning them properly is the cheapest way to sound like someone who already works here.
| Metric | What it means | What good looks like |
|---|---|---|
| GMV | Gross merchandise value: the rupee value of everything sold through the platform | Growth well ahead of the market's 19-21%. Always ask whether it is before or after discounts |
| Take rate | The share of GMV the platform keeps as revenue | Varies hugely by category. Beauty and fashion far above groceries and electronics |
| Contribution margin | What is left from an order after the costs that vary with that order | Positive. Instamart reached break-even here in May 2026; the industry took a decade |
| AOV | Average order value | Rising, or deliberately falling to widen the customer base. Either can be right, but management should say which |
| CAC and LTV | Cost to acquire a customer, and the value they generate over time | LTV comfortably above CAC, with a payback period under a year |
| Retention or repeat rate | The share of customers who come back | The number that decides whether growth compounds or has to be repurchased every month |
| MTU | Monthly transacting users: people who actually bought, not people who opened the app | Swiggy reported 27.5 million platform MTUs in the June 2026 quarter, up 27.4% |
| Dark store throughput | Orders per store per day, and items picked per hour | The operational number that decides whether a quick commerce location makes money |
Two of those deserve a closer look, because they are where most students go wrong. CAC and LTV get quoted as though they were facts, when both are estimates that depend heavily on assumptions - how far back you attribute a signup, how long you assume a customer keeps buying. A platform can make its payback period look much better by changing the assumption rather than the business. And retention is the number that quietly decides everything: a business with weak retention has to buy its growth again every month, which is why cohort charts are the first thing an investor asks for and the last thing a struggling company wants to show.
If you only remember one habit from this report, make it this one: never quote a growth rate without the period and the metric attached. “Revenue grew 173%” and “like-for-like revenue grew 66%” describe the same company in the same quarter. Everyone who works in the sector knows the difference, and the fastest way to sound credible is to show that you do too.
What to actually do next. These six steps are ordered, and none of them needs permission or a fee.
Every figure in this report is traceable to a company filing, the Bain and Flipkart How India Shops Online 2026 study, IBEF, or a government notification, with the period stated in the text. Data is current as of August 2026. This sector restates itself every quarter, so treat anything older than two quarters as context rather than fact.
