
Equity Valuation Metrics: P/E, EV/EBITDA and More
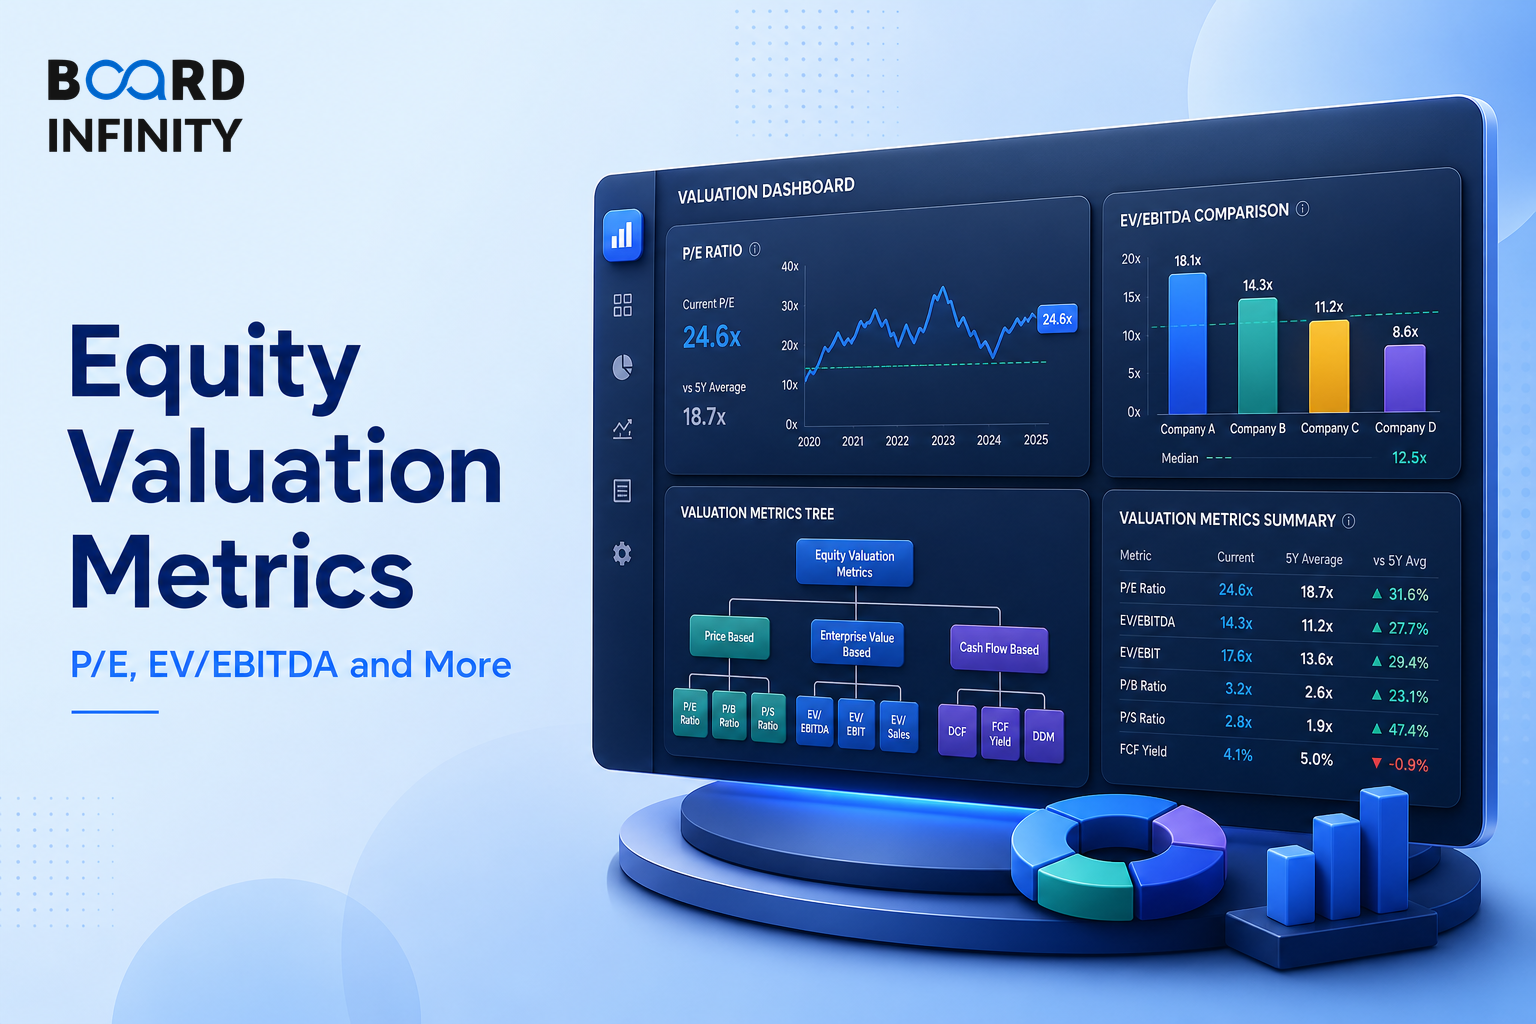
Valuation multiples provide a quick, market-relative sense of how a stock is priced compared to its earnings power, book value, or cash flows. In interviews, the real test is not memorising one number - it is knowing why the right metric depends on the industry, growth stage, and profitability profile.
- Valuation multiples provide a quick, market-relative sense of how a stock is priced compared to its earnings power, book value, or cash flows.
- No single multiple is universally correct - the right metric depends on the industry, growth stage, and profitability profile.
- P/E Ratio is best used for profitable, stable companies, while Forward P/E is useful for growth companies and consensus-driven sectors.
- P/B Ratio is best used for asset-heavy industries and banks, while EV/EBITDA is capital structure-neutral and useful for M&A and debt-heavy cos.
- EV/Revenue is used for pre-profit cos and high-growth tech/fintech, while PEG Ratio adjusts P/E for earnings growth rate.
- Dividend Yield is useful for income-focused; mature, cash-generative cos, with Coal India shown at 5-8%.
The Big Picture: A Market-Relative Toolkit
Equity valuation metrics compare a stock against earnings power, book value, cash flows, revenue, growth, or dividends. The same company can look expensive or cheap depending on the multiple chosen, so the correct metric depends on profitability, capital structure, sector norms, and growth stage.
No single multiple is universally correct - the right metric depends on the industry, growth stage, and profitability profile.
Core Terms Behind the Formulas
EPS means Earnings Per Share and is calculated as Net Profit / No. of Shares Outstanding. P/E Ratio, or Price-to-Earnings Ratio, uses Market Price / EPS as a valuation multiple.
EBITDA means Earnings Before Interest, Tax, Depreciation & Amortization. EV/EBITDA, or Enterprise Value to EBITDA, uses Enterprise Value / EBITDA and is key for M&A.
EV is Enterprise Value. In comparable company analysis, EV = Market Cap + Net Debt (+ minority interest + preferred equity).
How to Choose the Right Multiple
For profitable, stable companies, P/E Ratio is the natural starting point because it compares market price with EPS. For growth companies and consensus-driven sectors, Forward P/E uses Market Price / Next 12M EPS Estimate.
For asset-heavy industries and banks, P/B Ratio is more relevant because it compares Market Cap with Book Value of Equity. For capital structure-neutral comparisons, M&A, and debt-heavy cos, EV/EBITDA is preferred.
For pre-profit cos and high-growth tech/fintech, EV/Revenue is used because earnings may not yet be meaningful. For growth-adjusted valuation, PEG Ratio compares P/E with Earnings Growth Rate (%), where PEG < 1 = potentially undervalued and PEG 1-2 = fairly valued.
For income-focused; mature, cash-generative cos, Dividend Yield is useful. The benchmark row shows Indian market avg: 1-1.5%; Coal India: 5-8%; PSU banks: 3-5%.
P/E in Interviews: Why There Is No Universal Good Number
There is no universally good P/E - it depends on sector, growth rate, return profile, and market cycle. P/E is meaningful only in comparison: peer group average, historical range, and growth-adjusted (PEG ratio).
- High P/E justified: High-growth company (Zomato: 200x+ because market expects 30%+ growth for years); asset-light (Infosys: 25-30x vs. steel at 8-12x).
- Low P/E trap: A PSU bank at 8x P/E might be cheap or might reflect justified risk of NPA cycle, government interference, lower ROE.
- Indian benchmark: Nifty 50 historically trades 18-22x one-year forward P/E. Anything >30x requires strong growth justification; <12x is value territory unless earnings quality is poor.
- Final answer: A good P/E is one that is justified by the company's growth, returns, and risk profile relative to peers and the cost of capital.
Comparable Company Analysis Context
Trading comps, or CCA, value a company by applying the valuation multiples of similar public companies. The art is in selecting the right peer group and using the right multiple for each sector.
Structuring a Equity Valuation Metrics Interview Answer
"What is a good P/E ratio?"
The strongest answer avoids treating P/E as a standalone number. Always connect the multiple to sector, growth rate, return profile, market cycle, peers, PEG ratio, and the cost of capital.
The most frequent error is calling a stock cheap or expensive using only one multiple. A PSU bank at 8x P/E might be cheap or might reflect justified risk of NPA cycle, government interference, and lower ROE, so the multiple must be interpreted relative to sector, growth, returns, and risk.
Conclusion
Equity valuation multiples are a market-relative toolkit, not a universal scoring system. The right takeaway is simple: choose the metric that matches the company’s profitability, capital structure, sector norms, and growth stage.