
Profitability Metrics and Margins Explained
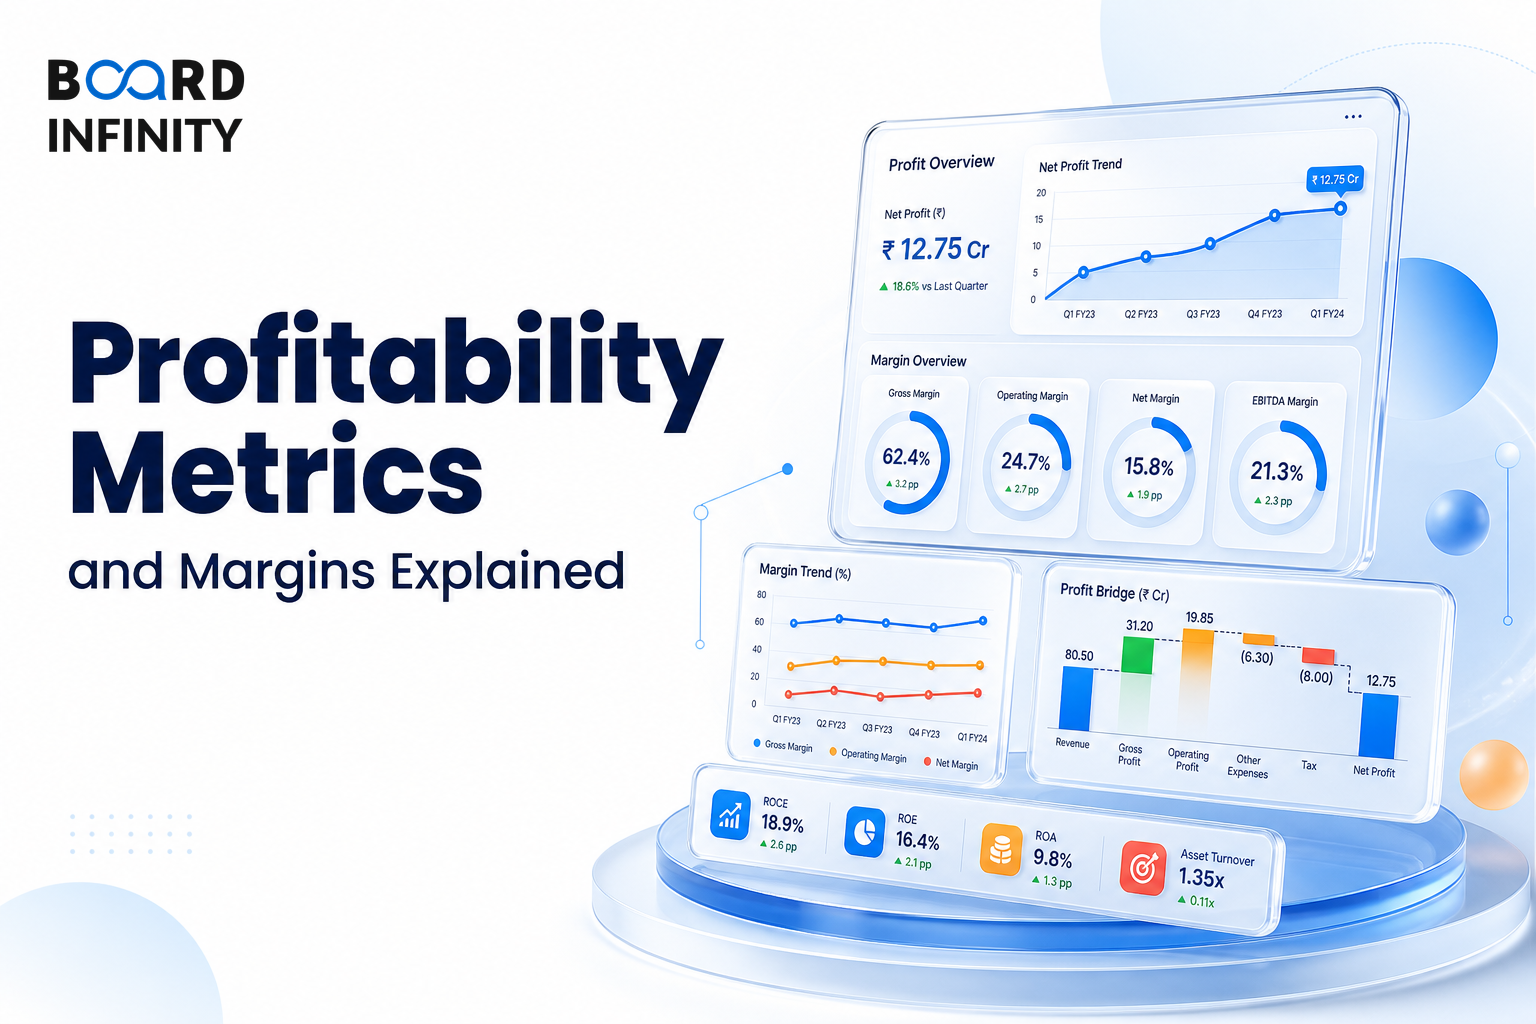
After Equity Valuation Metrics such as P/E and EV/EBITDA, the next question is whether the business is actually converting revenue into profit efficiently. Profitability metrics measure how efficiently a company converts revenue into profit at various levels of the income statement. In interviews, this matters because each margin or return metric reveals a different layer of business efficiency and value creation.
- Profitability metrics measure how efficiently a company converts revenue into profit at various levels of the income statement.
- Gross Margin measures pricing power and COGS efficiency.
- EBITDA Margin measures operating efficiency before D&A.
- Operating (EBIT) Margin measures core operating profitability.
- PAT Margin measures overall profitability for equity holders.
- ROE, ROA and ROCE measure return generated on equity base, efficiency of asset utilisation and return on all capital employed.
- ROCE > WACC = value creation.
The Profitability Margin Ladder
The margin ladder starts with Gross Margin, moves through EBITDA Margin and Operating (EBIT) Margin, and reaches PAT Margin. Return metrics then extend the analysis from profit conversion to capital efficiency through ROE, ROA and ROCE.
Profitability metrics measure how efficiently a company converts revenue into profit at various levels of the income statement.
Gross Margin
Gross Margin is calculated as Gross Profit / Revenue × 100. It measures pricing power and COGS efficiency.
The Indian benchmarks vary by sector: FMCG: 45-60%; IT Services: 35-40%; Pharma: 55-70%; Retail: 20-30%. This makes Gross Margin useful as the first layer of the margin ladder because it shows how much profit is retained after the direct cost base.
EBITDA Margin
EBITDA means Earnings Before Interest, Tax, Depreciation & Amortization. EBITDA is EBIT + D&A and is used as a proxy for operating cash flow.
EBITDA Margin is calculated as EBITDA / Revenue × 100. It measures operating efficiency before D&A, with benchmarks of IT: 22-28%; FMCG: 18-25%; Telecom: 40-50%; Steel: 12-20%.
Operating (EBIT) Margin
Operating (EBIT) Margin is calculated as EBIT / Revenue × 100. It measures core operating profitability.
The benchmarks given are IT: 20-26%; Auto OEMs: 8-14%. This metric sits below EBITDA Margin in the ladder because it focuses on core operating profitability after considering the layer captured by EBIT.
PAT Margin
PAT Margin is calculated as PAT / Revenue × 100. It measures overall profitability for equity holders.
The Indian benchmarks are IT: 18-24%; FMCG: 14-20%; Pharma: 10-18%. In interview answers, PAT Margin is the point where the margin ladder connects operating performance to equity-holder profitability.
ROE, ROA and ROCE
ROE means Return on Equity. It is calculated as PAT / Average Shareholders' Equity × 100 and measures return generated on equity base.
Indian examples include HDFC Bank: 16-18%; Infosys: 30-32%; HUL: 100%+ (asset-light). These examples show why ROE must be read with the business model in mind.
ROA means Return on Assets. It is calculated as PAT / Average Total Assets × 100 and measures efficiency of asset utilisation. Private Banks: 1.5-2.5%; PSU Banks: 0.5-1.2%.
ROCE means Return on Capital Employed. It is calculated as EBIT / (Total Assets - Current Liabilities) × 100 and measures return on all capital employed (debt + equity). WACC means Weighted Average Cost of Capital, and the quality benchmark is: ROCE > WACC = value creation.
Structuring a Profitability Metrics & Margins Explained Interview Answer
"How would you assess a company's profitability using profitability metrics and margins?"
Do not treat one profitability metric as sufficient. Gross Margin, EBITDA Margin, Operating (EBIT) Margin, PAT Margin, ROE, ROA and ROCE each measure a different layer of profitability or capital efficiency.
The most frequent error is comparing profitability metrics without sector context. FMCG, IT Services, Pharma, Retail, Telecom, Steel, Auto OEMs, Private Banks and PSU Banks have different benchmark ranges, so the same margin can mean different things depending on the business model.
Conclusion
Profitability metrics are best understood as a ladder from Gross Margin to PAT Margin and then to ROE, ROA and ROCE. The core takeaway is simple: margins show profit conversion, while return metrics show whether that profit creates value on the capital employed.