
Indian Sector Benchmarking: Key FY25E Ratios
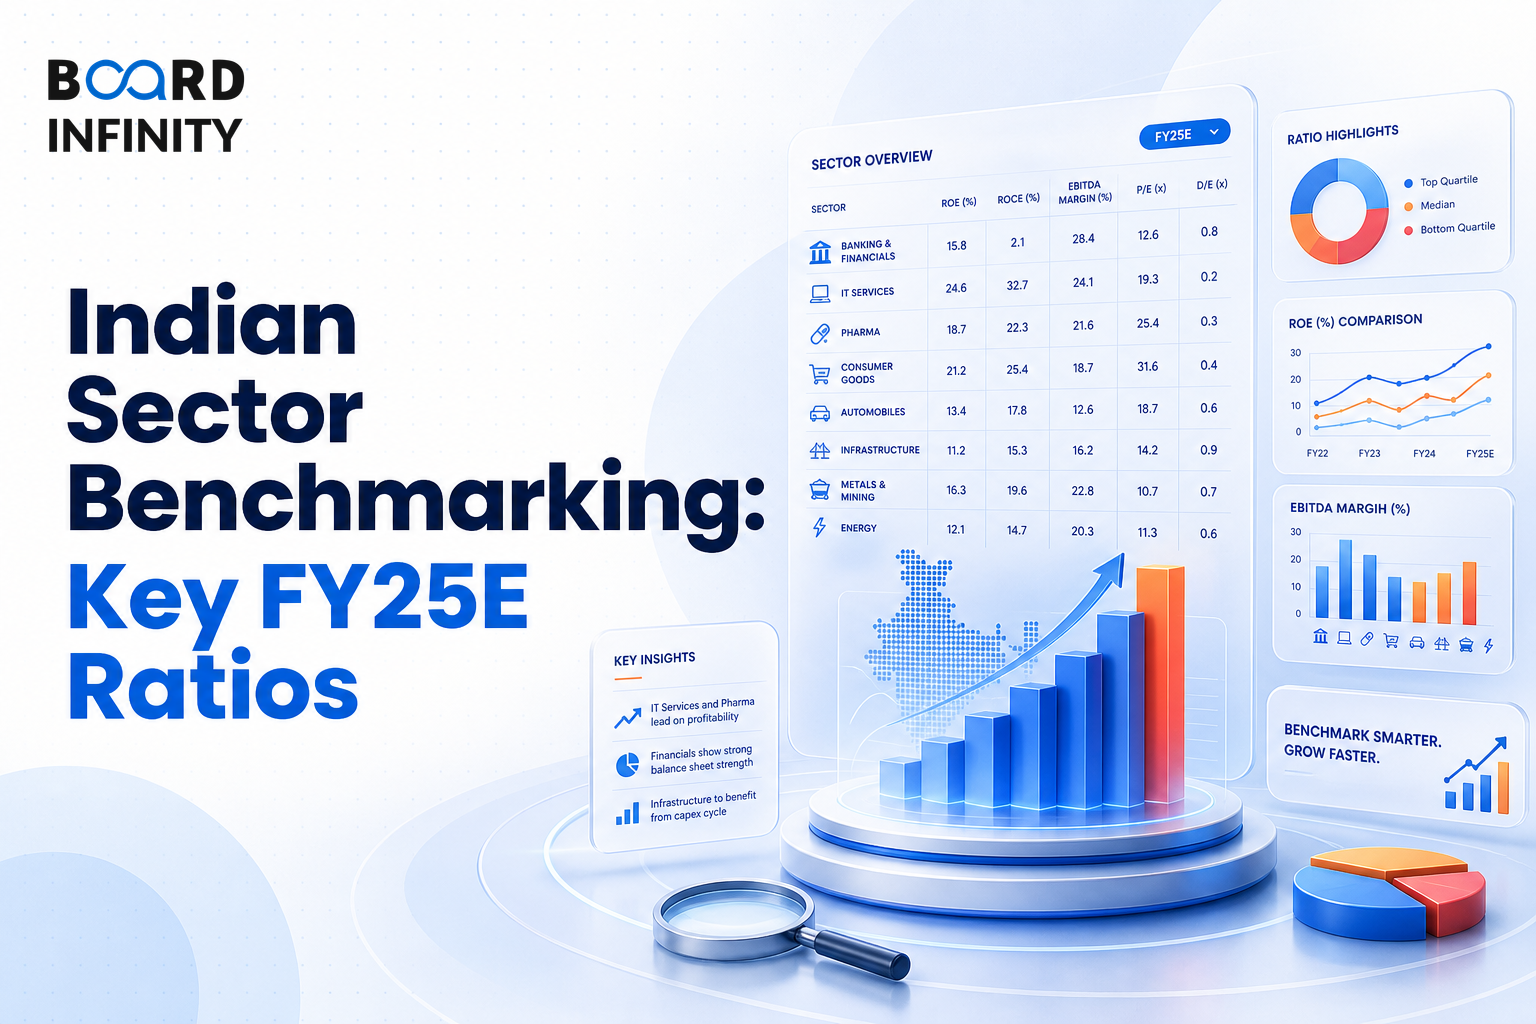
After Startup & VC Metrics: Unit Economics Explained, Indian Sector Benchmarking shifts the comparison from startup-level unit economics to listed-sector valuation, profitability, leverage, and growth ratios. In equity-analysis interviews, this matters because sector ranges provide a quick, market-relative sense of how a stock is priced compared to its earnings power, book value, or cash flows.
- Valuation multiples provide a quick, market-relative sense of how a stock is priced compared to its earnings power, book value, or cash flows.
- No single multiple is universally correct - the right metric depends on the industry, growth stage, and profitability profile.
- FY25E sector P/E ranges vary from PSU Banking at 7-12x to FMCG at 45-65x.
- EV/EBITDA ranges include IT Services at 18-25x, FMCG at 35-50x, Pharma at 15-22x, Auto OEMs at 10-15x, Infrastructure at 8-14x, and Telecom at 7-10x.
- EBITDA Margin is N/A for banking in this table; Private Banking is shown as N/A (NIM basis).
- D/E is Near 0 for IT Services, < 0.5x for FMCG and Pharma, 3-6x for Telecom, and 8-12x (leverage) for Private Banking.
- Rev. Growth (3Y CAGR) ranges from 5-10% for Telecom to 15-20% for Private Banking.
How to Read the Benchmark Sheet
This benchmark sheet compares sectors across P/E (FY25E), EV/EBITDA, EBITDA Margin, ROE, D/E, and Rev. Growth (3Y CAGR). Read the rows horizontally: valuation should be interpreted along with profitability, return profile, leverage, and growth.
P/E Ratio is Market Price / EPS and is best used for profitable, stable companies. EV/EBITDA is Enterprise Value / EBITDA and is capital structure-neutral; it is used for M&A and debt-heavy companies. EBITDA Margin is EBITDA / Revenue × 100 and measures operating efficiency before D&A. ROE is PAT / Average Shareholders' Equity × 100 and shows return generated on equity base. Debt/Equity (D/E) is Total Debt / Shareholders' Equity and measures financial leverage.
Sector-by-Sector Benchmarks
The table is designed as a quick Indian equity-analysis benchmark sheet. Each sector has a different valuation range because the right metric depends on the industry, growth stage, and profitability profile.
- Private Banking: P/E (FY25E) is 15-25x; EV/EBITDA is -; EBITDA Margin is N/A (NIM basis); ROE is 15-20%; D/E is 8-12x (leverage); Rev. Growth (3Y CAGR) is 15-20%.
- PSU Banking: P/E (FY25E) is 7-12x; EV/EBITDA is -; EBITDA Margin is N/A; ROE is 12-16%; D/E is -; Rev. Growth (3Y CAGR) is 10-15%.
- IT Services: P/E (FY25E) is 25-35x; EV/EBITDA is 18-25x; EBITDA Margin is 22-28%; ROE is 28-35%; D/E is Near 0; Rev. Growth (3Y CAGR) is 8-12%.
- FMCG: P/E (FY25E) is 45-65x; EV/EBITDA is 35-50x; EBITDA Margin is 18-25%; ROE is 40-80%+; D/E is < 0.5x; Rev. Growth (3Y CAGR) is 6-10%.
- Pharma: P/E (FY25E) is 20-35x; EV/EBITDA is 15-22x; EBITDA Margin is 18-28%; ROE is 15-22%; D/E is < 0.5x; Rev. Growth (3Y CAGR) is 10-14%.
- Auto OEMs: P/E (FY25E) is 18-28x; EV/EBITDA is 10-15x; EBITDA Margin is 10-15%; ROE is 14-20%; D/E is 0.2-0.8x; Rev. Growth (3Y CAGR) is 12-18%.
- Infrastructure: P/E (FY25E) is 15-25x; EV/EBITDA is 8-14x; EBITDA Margin is 20-35%; ROE is 10-15%; D/E is 2-4x; Rev. Growth (3Y CAGR) is 12-20%.
- Telecom: P/E (FY25E) is 30-50x; EV/EBITDA is 7-10x; EBITDA Margin is 40-50%; ROE is 5-10%; D/E is 3-6x; Rev. Growth (3Y CAGR) is 5-10%.
Valuation, Profitability, Leverage, and Growth Together
Valuation multiples should not be read in isolation. P/E (FY25E) and EV/EBITDA show how the sector is priced, EBITDA Margin shows operating efficiency before D&A, ROE shows return generated on equity base, D/E measures financial leverage, and Rev. Growth (3Y CAGR) gives the sector growth context.
This is why FMCG can show a P/E (FY25E) of 45-65x along with ROE of 40-80%+ and D/E of < 0.5x, while Telecom can show a P/E (FY25E) of 30-50x along with ROE of 5-10% and D/E of 3-6x. The benchmark becomes more useful when the ratios are compared as a set.
The most frequent error is comparing one sector's valuation multiple without checking the matching profitability, leverage, and growth range. A high P/E or EV/EBITDA range means little unless it is read with EBITDA Margin, ROE, D/E, and Rev. Growth (3Y CAGR).
Conclusion
Indian Sector Benchmarking is a quick way to compare FY25E sector ranges across valuation, profitability, leverage, and growth. The core takeaway is simple: use the full set of ratios together, not one multiple in isolation.