
Free Cash Flow Two Ways: To the Firm and to Equity Holders
A company can report a glossy profit and still have almost no spare cash after building stores, stocking inventory and servicing debt. Another company may show modest profit but throw off cash every quarter because customers pay fast and capex is light.
That before-after contrast is exactly why interviewers love free cash flow: it tells you who the cash truly belongs to - the whole firm or only equity shareholders.
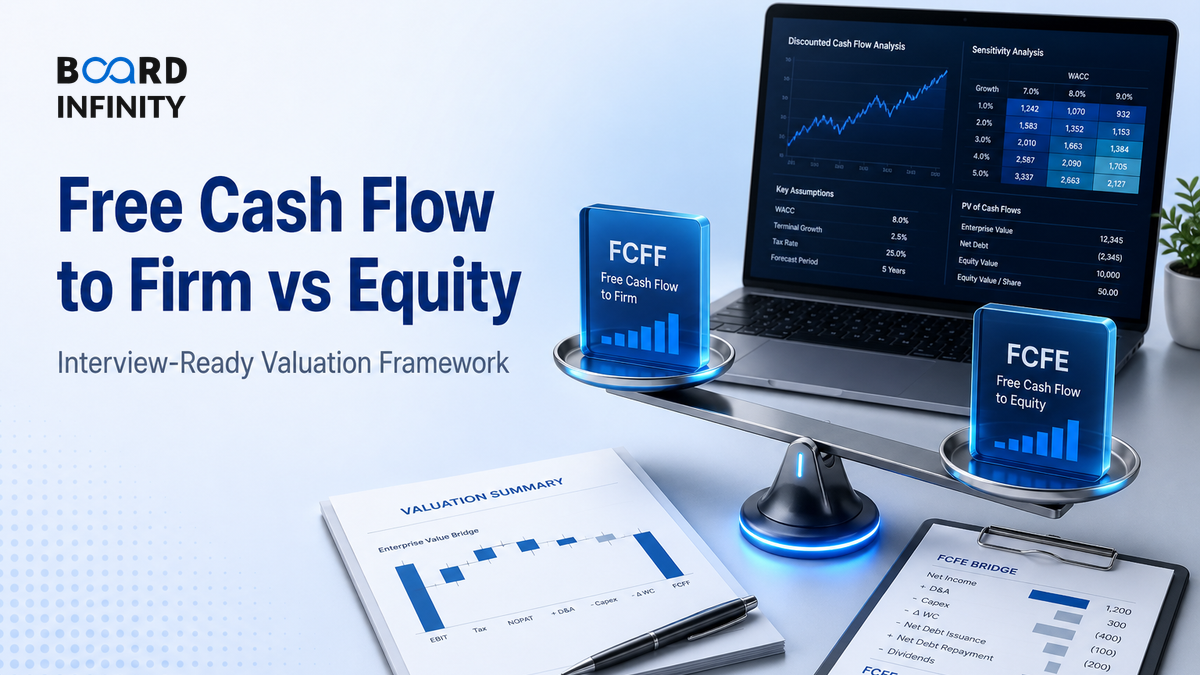
- FCFF is cash available to all capital providers - equity and debt - after tax and reinvestment.
- FCFE is cash available only to equity shareholders after interest, debt repayment and new borrowing.
- Core formula: FCFF = EBIT(1 - Tax Rate) + D&A - Capex - Change in NWC.
- Core formula: FCFE = Net Income + D&A - Capex - Change in NWC + Net Borrowing.
- Discount FCFF at WACC to get enterprise value; discount FCFE at cost of equity to get equity value directly.
- Use FCFF when leverage is changing or you want enterprise value; use FCFE when leverage is stable and equity cash flow is meaningful.
- The biggest trap: mixing the cash flow and discount rate - FCFF with cost of equity, or FCFE with WACC.
Big Picture: Same Business, Two Claimants
Free cash flow starts with the operating business, then asks a claimant question: is this cash before financing payments, or after financing payments? FCFF belongs to all capital providers; FCFE is what remains for common equity holders.
Core Explanation: How FCFF and FCFE Are Built
Free cash flow is not profit. Profit follows accounting rules; free cash flow tracks cash left after the business funds operations, taxes, working capital and fixed assets.
The cleanest way to remember the difference is this:
- FCFF stops before financing decisions. It ignores whether the company is debt-heavy or debt-light.
- FCFE includes financing effects. It asks what equity holders can receive after lenders are paid and net borrowing is considered.
The Two Formulas You Must Know
In interviews, write the formula first, then explain each adjustment in plain English.
What Each Adjustment Means
- EBIT(1 - T): Operating profit after tax, before interest. This keeps FCFF independent of debt structure.
- D&A: Depreciation and amortisation are added back because they reduced accounting profit but did not consume current-period cash.
- Capex: Cash spent on fixed assets such as stores, factories, servers or machinery. It is subtracted because it is reinvestment.
- Change in NWC: Increase in net working capital consumes cash; decrease releases cash. NWC usually means inventory plus receivables minus payables.
- Interest(1 - T): After-tax interest is subtracted when moving from FCFF to FCFE because lenders get paid before equity holders.
- Net Borrowing: New debt raised minus debt repaid. New borrowing increases cash available to equity; repayment reduces it.
Do not blindly use FCFF or FCFE for banks, NBFCs and insurers. For financial firms, debt is operating raw material, working capital is not comparable, and equity valuation usually uses dividend discount, residual income or excess return models.
Worked Example: Calculate FCFF, FCFE and Value
Assume a non-financial company reports the following numbers in ₹ crore:
Step 1 - FCFF
FCFF = EBIT(1 - T) + D&A - Capex - Change in NWC
FCFF = 1,000(1 - 25%) + 120 - 300 - 80 = ₹490 crore
Step 2 - FCFE
Net borrowing = New debt raised - Debt repaid = 200 - 60 = ₹140 crore
FCFE = FCFF - Interest(1 - T) + Net Borrowing
FCFE = 490 - 100(1 - 25%) + 140 = ₹555 crore
Step 3 - Valuation link
If next year cash flow grows at 4%, WACC is 10% and cost of equity is 13%:
- Enterprise value from FCFF = 490(1.04) / (10% - 4%) = ₹8,493 crore
- Equity value from FCFE = 555(1.04) / (13% - 4%) = ₹6,413 crore
The two values are not meant to be identical in a one-line shortcut unless assumptions about debt, growth, risk and terminal leverage are fully consistent. In a proper DCF, FCFF gives enterprise value first; then you subtract net debt and other non-equity claims to reach equity value.
Valuation Logic: Cash Flow Must Match the Discount Rate
The discount rate should reflect the risk of the claim being valued. FCFF is available to both lenders and shareholders, so its risk is the blended risk of debt and equity. FCFE is residual cash after debt payments, so it is riskier and must be discounted at the cost of equity.
Key Metrics to Track When Analysing Free Cash Flow
Free cash flow should be judged against industry structure, growth stage and capital intensity. A quick-commerce firm, a cement company and an FMCG company will not have the same healthy number.
Definitions
- FCFF: Cash available to all capital suppliers after operating taxes and required fixed-capital and working-capital investment.
- FCFE: Cash available to common shareholders after operating needs, reinvestment, interest, principal repayment and net borrowing.
- Enterprise Value: Value of the operating business available to all providers of capital.
- Equity Value: Value attributable to common shareholders after non-equity claims are deducted.
- WACC: Weighted average required return of debt and equity capital, adjusted for the tax shield on debt.
Case Study: Trent and the Cash Cost of Scaling Retail
Trent shows why a fast-growing retailer must be valued through reinvestment cash flows, not profit alone.

Trent, part of the Tata Group, operates retail formats including Westside and Zudio. The business sits in a category where growth is visible - more stores, more merchandise, more footfall - but the cash story is more layered.
Situation: India’s organised fashion retail market has been expanding as shoppers shift from unorganised stores to branded formats. For a retailer, accounting profit can improve while cash is simultaneously absorbed by new stores, inventory, store fit-outs and supply-chain capacity.
The move: Trent scaled differentiated fashion formats rather than treating retail as a generic store-count game. The primary driver was a strong format-market fit, especially in value fashion, supported by merchandising discipline, store-level operating execution, supply-chain coordination and brand architecture across formats.
The cash-flow lesson: An analyst should separate the operating engine from the financing route. FCFF captures whether the store network can generate cash after tax, inventory and capex. FCFE then asks what remains for shareholders after lease, debt and financing effects.
Outcome or lesson: Trent is a useful reminder that high growth is not automatically good and low free cash flow is not automatically bad. The decisive question is whether reinvested cash creates future operating cash flows at returns above WACC.
How AI Changes Free Cash Flow Analysis
AI does not change the formulas. It changes the speed and quality of the analyst’s reconciliation.
- Annual-report extraction: AI can pull EBIT, D&A, capex, working-capital movement, lease notes and debt schedules from long annual reports faster than manual reading. The analyst still verifies every number.
- Scenario modelling: AI-assisted spreadsheets can build sensitivity tables for growth, WACC, terminal growth, capex intensity and working-capital days. This is useful because small terminal assumptions can dominate DCF value.
- Management commentary analysis: LLMs can scan earnings-call transcripts for capex guidance, inventory issues, receivable delays and debt-refinancing comments that affect FCFF or FCFE forecasts.
Load a company annual report, latest investor presentation and earnings-call transcript into NotebookLM. Ask: “Extract the line items needed to calculate FCFF and FCFE, cite the page or note, and list three assumptions I must verify manually.”
Interview Relevance
“Explain the difference between free cash flow to the firm and free cash flow to equity. Which one would you use to value a company, and why?”
If given a numerical problem, first label whether the question asks for enterprise value or equity value. That single label tells you which cash flow and discount rate to use.
Common Mistake
The single error that costs candidates is mixing claimants: discounting FCFF using cost of equity, or discounting FCFE using WACC. It shows the interviewer that you memorised formulas without understanding valuation logic. One-line fix: first identify whose cash flow it is, then choose the matching discount rate.
What to Revise Next
Now connect cash flow to business-model quality. Revise Unit Economics for New-Age Businesses: Acquisition Cost, Lifetime Value & Burn to understand why fast-growing companies can consume cash intentionally. Then move to Indian Sector Benchmarks: What Healthy Looks Like by Industry so you can judge whether a company’s FCF margin, leverage and capex intensity are strong or weak in context.