
Liquidity & Solvency Ratios With Their Warning Thresholds
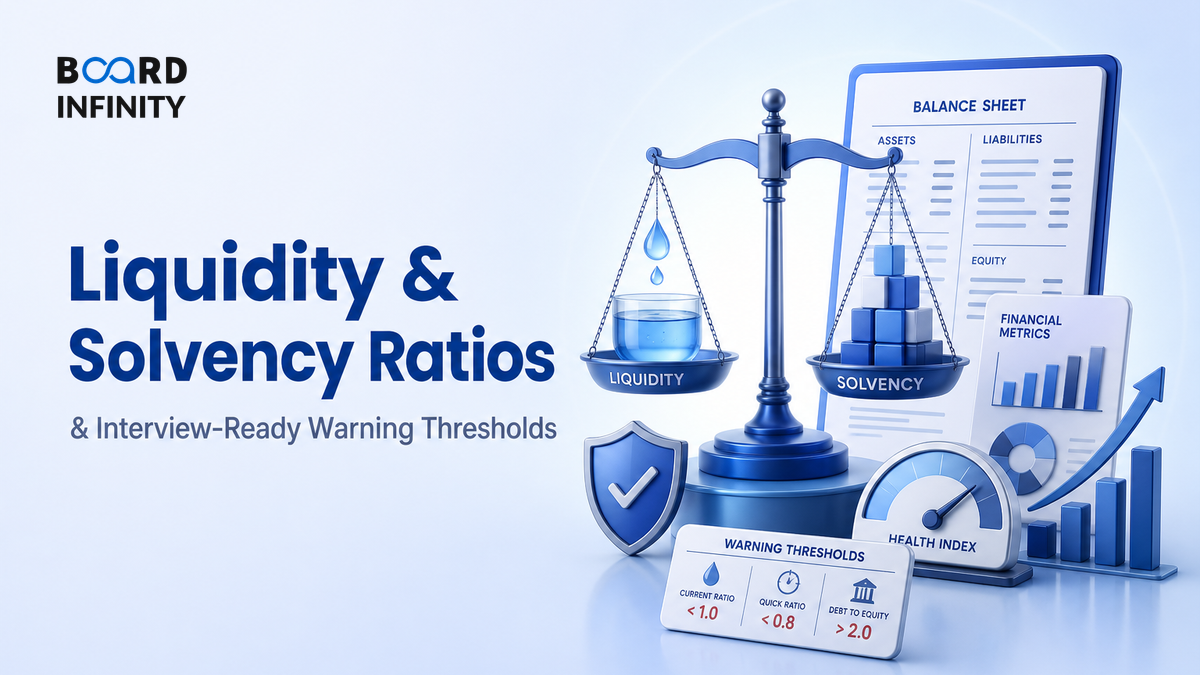
A company can report accounting profit and still run out of cash next month. That is the misconception liquidity and solvency ratios destroy - profit is not safety; cash timing and debt capacity are safety.
- Liquidity asks: can the firm meet near-term obligations such as suppliers, salaries, rent and short-term debt?
- Solvency asks: can the firm survive long term with its debt, interest burden and capital structure?
- Key liquidity ratios: current ratio, quick ratio, cash ratio and operating cash flow ratio.
- Key solvency ratios: interest coverage, debt-to-equity, debt-to-EBITDA and DSCR.
- Warning thresholds are not universal. Compare with industry, business model, seasonality, cash conversion cycle and debt maturity schedule.
- The most dangerous pattern is liquidity stress turning into solvency distress: stretched payables, falling cash, rising borrowing, then covenant pressure.
- Interview answer rule: calculate ratios, compare with thresholds, explain drivers, then give a judgement - healthy, watchlist or distress.
Big Picture - Liquidity Is Survival Now, Solvency Is Survival Later
Think of financial health as two clocks running at the same time. Liquidity is the short clock - what must be paid in weeks or months. Solvency is the long clock - whether the business model can carry its debt over years.
Core Explanation - What Each Ratio Actually Tells You
Ratios are not decorative calculations. They are financial warning lights. A good answer says what the ratio measures, calculates it correctly, interprets it against a threshold, and then checks whether the business context supports that interpretation.
Important: thresholds are rules of thumb, not laws. A supermarket, airline, NBFC, SaaS company and cement manufacturer can have very different normal levels because their inventory, receivables, capex and debt structures differ.
The Ratio Diagnosis Loop
Strong candidates do not stop at “current ratio is low.” They ask why it is low, whether the problem is temporary, and whether management has credible options to fix it.
Definitions You Can Say in One Breath
- Liquidity ratio: A measure of whether current assets and cash flows can cover obligations due within the next year.
- Solvency ratio: A measure of whether operating earnings and capital structure can support debt obligations over the long term.
- Working capital: Current assets minus current liabilities; it is the short-term operating cushion of the business.
- EBITDA: Earnings before interest, tax, depreciation and amortisation; a proxy for operating cash generation before capex and working capital.
Worked Example - Spot the Warning Lights in 3 Minutes
Assume a hypothetical manufacturing company, Alpha Components, reports the following: current assets ₹500 crore, inventory ₹180 crore, cash ₹40 crore, current liabilities ₹420 crore, cash flow from operations ₹120 crore, EBIT ₹160 crore, interest expense ₹70 crore, total debt ₹900 crore and EBITDA ₹300 crore.
Diagnosis: Alpha is not insolvent, but it belongs on a watchlist. The primary concern is thin short-term liquidity, supported by weak cash cover and only moderate interest protection.
Healthy, Watchlist or Distress - A 2x2 View
The cleanest way to interpret liquidity and solvency together is a 2x2. It prevents the common mistake of calling a company “safe” just because one ratio looks fine.
Case Study - Future Retail: When Liquidity Stress Became Solvency Distress
Future Retail shows how weak cash conversion, stretched obligations and heavy debt can push a large operating business from liquidity pressure into insolvency proceedings.

Situation: Future Retail operated large-format retail stores in India, including formats associated with organised grocery and value retail. The model depended on high store footfall, inventory rotation, supplier credit, rental commitments and working-capital discipline.
The stress: The primary driver was a cash-flow and leverage squeeze: store disruptions and weak operating cash flows made it harder to meet obligations on time. Supporting drivers included high fixed costs such as leases, supplier payables, debt servicing pressure, and uncertainty around a proposed transaction involving Reliance Retail that became caught in legal and approval challenges.
The outcome and lesson: Lenders initiated insolvency proceedings, and the company was admitted into corporate insolvency resolution under India's Insolvency and Bankruptcy Code in 2022. The lesson is sharp: liquidity ratios are early smoke alarms, but if cash stress persists, the issue can migrate into solvency - debt capacity, creditor confidence and going-concern risk.
So what: Do not diagnose distress from one ratio. Future Retail matters because the primary driver - cash-flow pressure under leverage - was reinforced by fixed costs, creditor pressure and transaction uncertainty.
How AI Changes Liquidity & Solvency Ratios
AI does not make ratios obsolete. It makes ratio monitoring faster, more forward-looking and more forensic. Instead of waiting for quarterly statements, finance teams can combine ERP data, bank feeds, invoices, collections and debt schedules to forecast warning lights earlier.
- Predictive liquidity: AI models can forecast cash gaps using sales orders, collections history, vendor payment cycles and payroll schedules.
- Covenant intelligence: LLMs can extract interest cover, leverage and DSCR clauses from loan documents, then compare them with forecast ratios.
- Early-warning dashboards: AI can flag patterns humans miss - rising DSO, vendor stretch, inventory pile-up, short-term debt rollover risk and declining cash conversion.
Use NotebookLM or ChatGPT like an analyst assistant: upload the company's annual report, quarterly results and credit-rating rationale, then ask, “Extract liquidity and solvency ratios, compare with prior years, identify warning signals, and create a 90-second interview answer.” Always verify the formulas manually.
Interview Relevance
“A company has a current ratio below 1 but is still profitable. Is it financially unhealthy? How would you analyse it using liquidity and solvency ratios?”
Use the phrase: “I would not treat the threshold mechanically. I would triangulate it with industry norms, cash conversion cycle, debt maturity and operating cash flow.” That sounds like finance judgement, not textbook recall.
Common Mistake
The mistake: treating ratio thresholds as universal pass-fail cutoffs. A current ratio of 1.1x may be acceptable for a fast-cash retail model but risky for a slow-moving inventory business. The fix: always interpret ratios with industry, trend, cash conversion, debt maturity and covenant context.
What to Revise Next
Once you can judge whether a company can pay and survive, move to whether it earns enough and uses capital well. Revise these next: