
Leverage & Coverage Ratios Lenders Actually Test
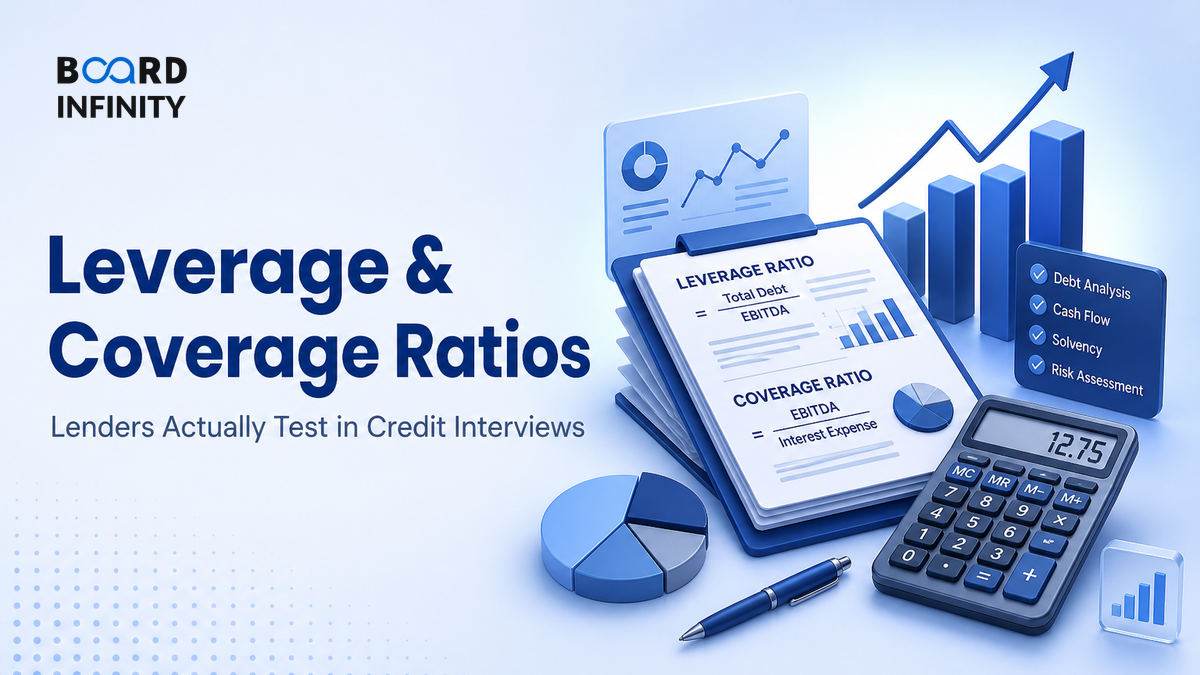
A credit committee does not start with a grand theory of finance. It opens a loan memo, checks whether cash can survive interest, principal repayments and a bad quarter, and then asks one brutal question: “If things go wrong, do we still get paid?”
That is the job of leverage and coverage ratios. They turn a borrower’s balance sheet and cash flow into a lender’s safety dashboard.
- Leverage ratios measure how much debt sits on the business relative to earnings, assets or equity.
- Coverage ratios measure whether operating cash flow can pay interest, principal and fixed charges on time.
- The lender’s first screen is usually Net Debt / EBITDA; the repayment screen is usually DSCR.
- Typical comfort zones vary by sector, but many lenders like Net Debt/EBITDA below about 2.0x-3.0x and DSCR above about 1.2x-1.5x.
- A ratio is not judged alone - lenders adjust EBITDA, net off surplus cash, include lease debt, and test covenant headroom.
- The strongest answers connect ratios to business cyclicality, cash conversion, asset backing and refinancing risk.
- The biggest trap is quoting formulas without explaining whether the borrower can actually repay debt in a downturn.
The Big Picture: Lenders Follow the Cash Waterfall
Equity investors ask, “How much upside can I capture?” Lenders ask, “How many layers of cash sit above my claim?” Leverage ratios show the size of the debt load; coverage ratios show whether cash reaches debt service after operating needs.
Core Explanation: Leverage Tells “How Much Debt”; Coverage Tells “Can It Pay?”
Leverage is a stock-of-debt question. It compares debt to EBITDA, assets or equity to judge how burdened the borrower is.
Coverage is a flow-of-cash question. It compares earnings or cash available to interest, principal repayment and lease or fixed charges.
In credit analysis, the two must be read together. A company can look acceptable on leverage but fail coverage if interest rates rise or cash conversion is weak. It can also look weak on accounting leverage but be bankable if cash flows are contracted and stable, as in some infrastructure or utility assets.
The Lender Ratio Workflow: 6 Measures They Actually Test
Credit teams do not stop at one ratio. They move from broad debt load to true repayment capacity, then check whether the borrower has enough cushion before breaching covenants.
Important: these are not universal pass marks. A toll road with contracted cash flows may support different leverage from a steel producer exposed to commodity cycles. A software company with recurring revenue may be judged differently from a real estate developer with lumpy collections.
Worked Example: Same Borrower, Two Different Signals
Assume a manufacturing company has total debt of ₹500 crore, cash of ₹80 crore, EBITDA of ₹140 crore, EBIT of ₹100 crore, interest expense of ₹35 crore and scheduled principal repayment of ₹45 crore. Cash flow available for debt service is ₹105 crore.
The right answer is not “good” or “bad” in isolation. A lender would ask: Is EBITDA stable? Is working capital absorbing cash? Are repayments back-ended? Is the cash freely usable? Are there near-term refinancing needs?
Definitions You Can Say in One Breath
Leverage ratio: A ratio that measures a company’s debt burden relative to earnings, assets, equity or capital.
Coverage ratio: A ratio that measures how many times earnings or cash flow can meet required debt or fixed payments.
DSCR: Cash flow available for debt service divided by interest plus scheduled principal repayment.
Covenant headroom: The cushion between the borrower’s actual ratio and the maximum or minimum level allowed by the loan agreement.
How Lenders Interpret the Ratios: The Covenant Headroom Map
A ratio becomes powerful when linked to a covenant. Covenants are loan conditions that protect lenders by forcing early action before default. For example, a borrower may be required to keep Net Debt/EBITDA below a specified limit and DSCR above a specified floor.
Case Study: Tata Steel and the Discipline of Deleveraging
Tata Steel shows how lenders read leverage through the cycle: not only how much debt exists, but whether the company has a credible path to reduce it using operating cash flow and capital discipline.
Situation: Steel is a cyclical business. Prices, raw material costs, global demand and energy costs can move sharply, so lenders do not treat a high-EBITDA year as permanently safe. After major acquisitions and expansion phases, Tata Steel carried meaningful debt, and the credit question became simple: could the company keep reducing leverage while funding capex and surviving steel-cycle volatility?
The move: Tata Steel repeatedly communicated a focus on deleveraging, cash generation and disciplined capital allocation. The primary driver was operating cash flow from the steel business during stronger periods. Supporting drivers included active working-capital management, prioritisation of capex, portfolio actions where needed, and a stated commitment to balance-sheet strength.
Outcome or lesson: The case teaches a lender’s real lens. A commodity company is not judged only on one year’s Net Debt/EBITDA. Lenders also ask whether leverage can stay acceptable when EBITDA normalises, whether maturities are manageable, and whether management uses good cycles to repair the balance sheet instead of adding uncontrolled debt.

Strategic so what: For cyclical companies, the best credit story is not “EBITDA is high this year.” It is “even after stress-testing EBITDA, cash conversion and maturities, the borrower has enough coverage and a credible deleveraging path.”
How AI Changes Leverage & Coverage Ratios
AI does not replace credit judgment, but it changes how quickly analysts can spot stress, inconsistencies and covenant risk.
- Faster covenant extraction: LLM tools can scan loan documents, annual reports and rating rationales to extract covenant thresholds, repayment schedules and definitions of EBITDA. The key is verification because legal definitions can differ from textbook formulas.
- Early-warning credit monitoring: Machine learning models can flag borrowers whose margins, receivable days, inventory levels or refinancing news are moving in a direction that may weaken DSCR or interest cover.
- Scenario generation: Analysts can use AI to create downside cases - for example, lower EBITDA, higher interest rates and slower collections - then test covenant headroom under each case.
Load a company’s annual report and latest investor presentation into NotebookLM. Ask it to extract total debt, cash, EBITDA, finance costs, maturities and management commentary on deleveraging. Then calculate Net Debt/EBITDA, Interest Coverage and DSCR yourself in Excel - do not outsource the final ratio judgment.
Interview Relevance
“A company has Net Debt/EBITDA of 3.5x and Interest Coverage of 4.0x. Would you lend to it?”
Use the phrase “I would not lend on the headline ratio alone”. It signals maturity because real lenders adjust EBITDA, study cash conversion and test downside cases.
Common Mistake
The most common mistake is treating ratios as mechanical cutoffs - “below 3x is good, above 3x is bad.” That fails because lenders judge ratios by sector risk, cash-flow stability, covenant definitions, maturity profile and stress scenarios. Fix: quote the formula, interpret the level, then immediately ask what happens in a downside case.
What to Revise Next
Once you are comfortable with lender ratios, move to the investor side of the same company. Revise Valuation Multiples and What Each One Quietly Assumes to understand how markets price earnings and cash flows, then study The Enterprise Value Bridge from Enterprise Value to Equity Value to connect operating value, debt, cash and equity value.