The Income Statement - Reading and Interpreting a P&L
In Finance Foundations - Core Concepts Every Student Must Know, you saw why revenue, cost, profit, and cash are the language of business. The Income Statement takes those ideas and arranges them into a clear top-to-bottom performance story. In interviews, it matters because a candidate who can read a P&L can explain not just whether a company made money, but where that money was earned, spent, protected, or lost.
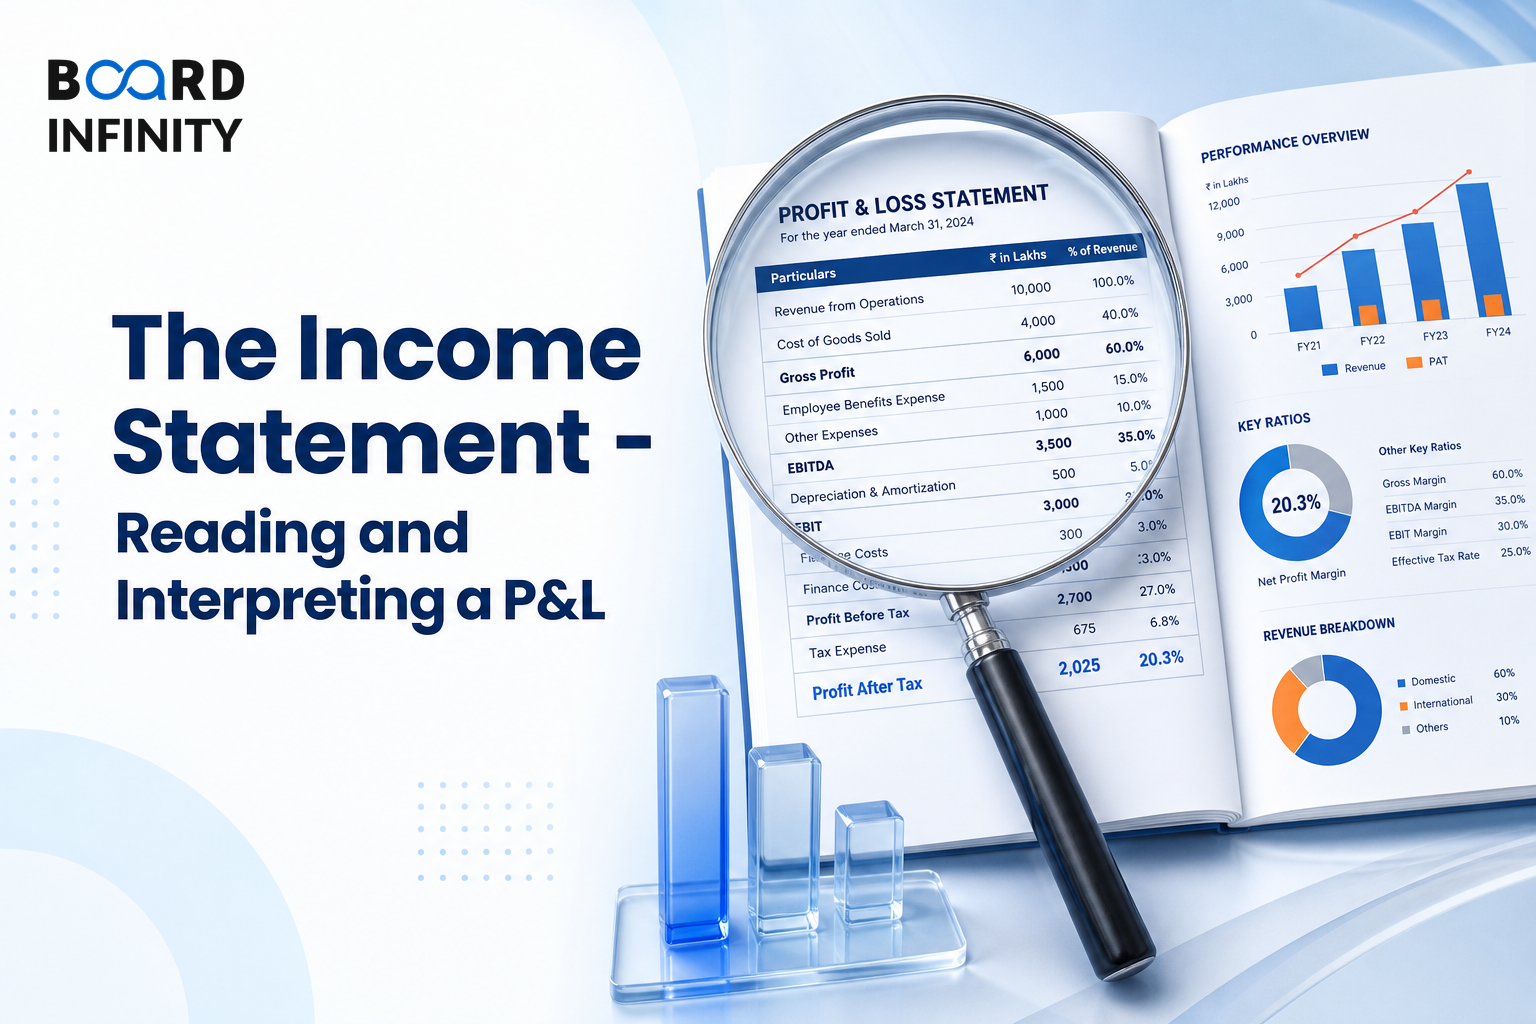
- The Income Statement, also called the P&L - Profit and Loss Account, reports a company's financial performance over a period such as a quarter or year.
- It is a waterfall statement because it starts with Revenue from Operations at the top and moves downward to PAT - Profit After Tax, or Net Profit.
- For TCS FY2024, Revenue from Operations was ₹2,40,893 Cr and PAT was ₹45,908 Cr, equal to a 19.1% PAT margin.
- Key operating lines include Cost of Revenue, Gross Profit, SG&A or overheads, EBITDA, Depreciation and Amortization, and EBIT.
- Key margins show different types of performance: Gross Margin shows delivery efficiency, EBITDA Margin shows operating efficiency before capex, EBIT Margin shows post-depreciation operating leverage, and PAT Margin shows bottom-line profitability.
- TCS FY2024 reported a 25.0% EBITDA margin and 19.1% PAT margin, reflecting the asset-light, high-skill nature of Indian IT services.
- In interviews, read the P&L sequentially: revenue base, direct costs, operating profit, non-operating items, tax, and final profit for shareholders.
The Big Picture - The P&L as a Waterfall
The Income Statement answers three practical questions: how much did the company earn, how much did it spend, and what was the final net profit or loss. The easiest way to read it is as a waterfall where each level either deducts a cost or adds an income item before reaching the bottom line.
The Income Statement, also called the P&L - Profit and Loss Account, reports a company's financial performance over a period such as a quarter or year, flowing from Revenue at the top to Net Profit at the bottom.
Here is the whole waterfall before we break down the individual line items.
What the Income Statement Measures
The P&L is a period statement. That means it reports performance during a quarter or year rather than giving only a single closing figure. In the TCS FY2024 example, the P&L explains how ₹2,40,893 Cr of Revenue from Operations ultimately became ₹45,908 Cr of PAT.
This makes the statement especially useful for interview analysis. Instead of saying only “TCS is profitable,” you can explain the drivers: gross profitability, operating efficiency, depreciation impact, low finance costs, other income, taxes, and final shareholder profit.
Read any Income Statement in this order: Revenue from Operations, Cost of Revenue, Gross Profit, operating overheads, EBITDA, Depreciation and Amortization, EBIT, Finance Costs, Other Income, PBT, Tax Expense, and PAT.
TCS FY2024 Income Statement Structure
TCS FY2024 is a clean example because the statement shows both absolute rupee values and each line item as a percentage of revenue. That percentage view is important because it converts large accounting numbers into margins, making the performance easier to compare across line items.
Revenue, Cost of Revenue, and Gross Profit
Revenue from Operations is the top line. For TCS FY2024, it was ₹2,40,893 Cr, representing 100.0% of revenue. In this example, it means total billings from IT services and products.
Cost of Revenue, also shown as COGS - Cost of Goods Sold or direct cost of service delivery, was ₹1,17,636 Cr, equal to 48.8% of revenue. For TCS, the source identifies this mainly as direct delivery costs such as salaries of tech staff.
Gross Profit is Revenue minus COGS. TCS FY2024 Gross Profit was ₹1,23,257 Cr, or 51.2% of revenue. This line reflects delivery efficiency - how much value remains after the direct cost of providing services and products.
Gross Profit = Revenue from Operations - Cost of Revenue. For TCS FY2024, ₹2,40,893 Cr - ₹1,17,636 Cr = ₹1,23,257 Cr.
Operating Expenses, EBITDA, and EBIT
After gross profit, the Income Statement moves into the operating layer. SG&A means Sales, General and Administrative expenses, and the TCS FY2024 figure is shown with overheads at ₹43,361 Cr, or 18.0% of revenue. These are not direct delivery costs, but they support the business through sales, general administration, and support functions.
EBITDA means Earnings Before Interest, Taxes, Depreciation and Amortization. TCS FY2024 EBITDA was ₹60,260 Cr, or 25.0% of revenue. This margin is useful because it looks at operating earnings before Depreciation and Amortization, which the source describes as non-cash charges on fixed assets and intangibles.
EBIT means Earnings Before Interest and Taxes, also called Operating Profit. TCS FY2024 EBIT was ₹55,550 Cr, or 23.1% of revenue. This is the core business earning before financing, after deducting Depreciation and Amortization of ₹4,710 Cr.
Finance Costs, Other Income, PBT, Tax, and PAT
Once EBIT is calculated, the P&L moves below operating profit. Finance Costs are interest costs on borrowings. For TCS FY2024, Finance Costs were ₹238 Cr, just 0.1% of revenue, and the source notes that TCS is near debt-free.
Other Income was ₹4,653 Cr, or 1.9% of revenue. In the TCS example, this includes treasury income and forex gains. This is why an interviewer may ask you to separate operating performance from non-operating income: EBIT shows core business earnings, while PBT includes financing and other income effects.
PBT means Profit Before Tax. For TCS FY2024, PBT was ₹59,965 Cr, equal to 24.9% of revenue. The source gives the relationship as EBIT minus Interest plus Other Income.
PAT means Profit After Tax, also called Net Profit or the bottom line. TCS FY2024 PAT was ₹45,908 Cr, equal to 19.1% of revenue, after Tax Expense of ₹15,178 Cr. The source notes that the tax expense includes current and deferred tax and reflects an ETR - Effective Tax Rate - of approximately 25%.
PBT = EBIT - Interest + Other Income. For TCS FY2024, this connects EBIT of ₹55,550 Cr, Finance Costs of ₹238 Cr, and Other Income of ₹4,653 Cr to PBT of ₹59,965 Cr.
Margin Analysis - What Each Percentage Reveals
A margin expresses a line item as a percentage of revenue. The TCS table uses this approach throughout, which is why you can quickly see how much of every ₹100 of revenue remains at each stage of the waterfall.
For TCS FY2024, the source highlights four important margins: Gross Margin, EBITDA Margin, EBIT Margin, and PAT Margin. Each tells a different story, so a strong answer avoids treating all profit margins as the same.
The source states that TCS FY2024 EBITDA margin of 25.0% and PAT margin of 19.1% are among the best in global IT. The reason given is the asset-light, high-skill nature of Indian IT services. This is a strong interview point because it links accounting numbers to business model quality.
Worked Example - Interpreting TCS FY2024 Like an Interview Case
Suppose an interviewer gives you the TCS FY2024 Income Statement and asks whether the company shows strong operating efficiency and profitability. A good response should not jump directly to PAT. It should use the waterfall to show where profit is created and where it is reduced.
The key learning is that the final PAT number is not enough by itself. You earn more interview points when you explain the path from revenue to profit and show which margins support your conclusion.
How to Avoid Misreading the Bottom Line
The bottom line belongs to shareholders, but it is affected by many layers above it. In TCS FY2024, PAT was ₹45,908 Cr, but that number came after delivery costs, overheads, Depreciation and Amortization, Finance Costs, Other Income, and Tax Expense.
EPS - Earnings Per Share - gives a per-share view of profit. The TCS FY2024 Basic EPS was ₹124.6, calculated as PAT divided by total shares of approximately 369 Cr shares. In interviews, EPS is useful only after you understand the PAT that feeds it.
EPS = PAT / Total Shares. For TCS FY2024, Basic EPS was ₹124.6 based on PAT and approximately 369 Cr shares.
Structuring a The Income Statement Interview Answer
"Walk me through an Income Statement using TCS FY2024. What do the margins tell you?"
The strongest answers do not list line items mechanically. They explain what changes from one layer to the next and use margins to prove whether the company is efficient, profitable, or both.
Conclusion
The Income Statement is a performance waterfall: it begins with revenue, deducts costs and taxes, adjusts for financing and other income, and ends with profit belonging to shareholders. For TCS FY2024, the movement from ₹2,40,893 Cr of revenue to ₹45,908 Cr of PAT shows how margins turn accounting data into business insight.
The most frequent mistake is treating revenue as profit and jumping straight from the top line to the bottom line. This costs points because it ignores the waterfall logic - especially Gross Margin, EBITDA Margin, EBIT Margin, and PAT Margin, which reveal where performance is actually created or reduced.