
Key Banking Metrics: NIM, CASA and GNPA Scorecard
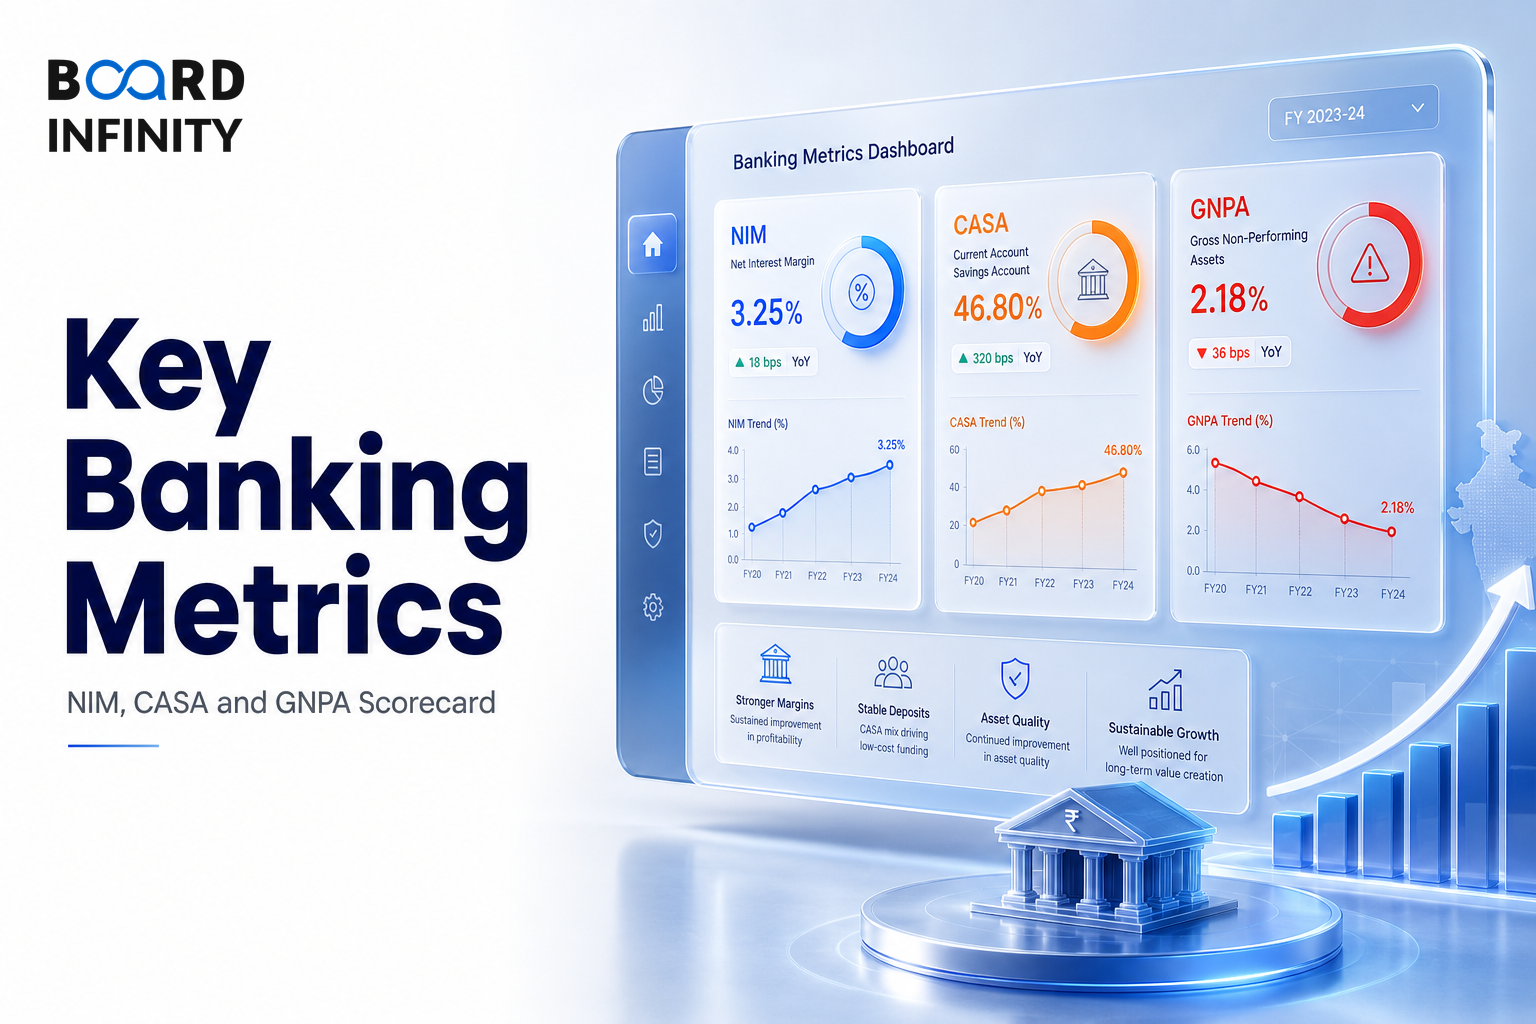
After Digital Banking & the Fintech Revolution in India, the next question is how to read the banks behind those products and partnerships. Key banking metrics give an interview-ready scorecard for judging a bank’s profitability, funding strength, asset quality, efficiency, and return profile using FY24 benchmarks from major Indian banks.
- NIM (Net Interest Margin) is calculated as (Interest Income - Interest Expense) / Avg Earning Assets, with private bank benchmark at 3.5-4.5% and PSU benchmark at 2.5-3.2%.
- CASA Ratio is (CA + SA Deposits) / Total Deposits, where >40% = strong and <30% = expensive funding.
- GNPA Ratio is Gross NPA / Gross Advances, with private <2% and PSU <5% = healthy.
- NNPA Ratio is Net NPA / Net Advances, where <1% = strong and <0.5% = excellent.
- PCR (Provision Coverage) is Provisions / Gross NPA, where >70% = prudent and >80% = very safe.
- Credit Cost is Provisions / Avg Loan Book, with normalised 0.5-1.0% and <0.5% = benign cycle.
- ROA, ROE, and C/I Ratio complete the scorecard for return profile and efficiency.
Banking Metrics Scorecard
Banks require a separate set of metrics due to their unique business model - they intermediate between depositors and borrowers, making traditional profitability ratios insufficient. The scorecard below compares HDFC Bank, SBI, and Kotak Bank on FY24 metrics and benchmarks.
Source: Company Quarterly Reports, HDFC Bank/SBI/Kotak Mahindra Bank FY2024.
Profitability: NIM
NIM (Net Interest Margin) is calculated as (Interest Income - Interest Expense) / Avg Earning Assets. Higher NIM = better spread between lending and deposit rates.
In FY24, HDFC Bank reported 4.3%, SBI reported 3.3%, and Kotak Bank reported 5.0%. The benchmark is Private: 3.5-4.5%; PSU: 2.5-3.2%.
Funding Strength: CASA Ratio
CASA Ratio means Current Account + Savings Account deposits as a share of total deposits. The formula is (CA + SA Deposits) / Total Deposits.
Higher CASA = cheaper funding; CASA deposits are near-zero cost. HDFC Bank reported 38%, SBI reported 43%, and Kotak Bank reported 49%, with >40% = strong and <30% = expensive funding.
Asset Quality: GNPA, NNPA, PCR and Credit Cost
GNPA Ratio is Gross NPA / Gross Advances. NPA means Non-Performing Asset - loan overdue >90 days; stressed asset. For FY24, HDFC Bank reported 1.24%, SBI reported 2.24%, and Kotak Bank reported 1.73%, with Private <2% and PSU <5% = healthy.
NNPA Ratio is Net NPA / Net Advances. It is net of provisions and is a cleaner measure of actual credit quality. HDFC Bank reported 0.33%, SBI reported 0.57%, and Kotak Bank reported 0.34%, with <1% = strong and <0.5% = excellent.
PCR (Provision Coverage) is Provisions / Gross NPA. Provision Coverage Ratio - higher = more conservative provisioning. HDFC Bank reported 74%, SBI reported 91%, and Kotak Bank reported 73%, with >70% = prudent and >80% = very safe.
Credit Cost is Provisions / Avg Loan Book. It is the annual credit loss rate and a key driver of net profit for banks. HDFC Bank reported 0.4%, SBI reported 0.3%, and Kotak Bank reported 0.5%, with normalised: 0.5-1.0% and <0.5% = benign cycle.
Return Profile: ROA and ROE
ROA is Net Profit / Avg Total Assets. HDFC Bank reported 1.9%, SBI reported 1.0%, and Kotak Bank reported 2.2%, with Private >1.5% and PSU >0.8%.
ROE is Net Profit / Avg Shareholders' Equity. HDFC Bank reported 17.0%, SBI reported 18.9%, and Kotak Bank reported 14.5%, with >15% for private and >12% for PSUs.
Efficiency: C/I Ratio
C/I Ratio (Cost-to-Income) is Operating Expenses / Net Revenue. Lower = better; <45% = efficient; >60% = concern.
In FY24, HDFC Bank reported 42%, SBI reported 55%, and Kotak Bank reported 46%. This makes the C/I Ratio a useful efficiency check alongside profitability, funding, asset quality, and return metrics.
How to Use the Scorecard
Always quote a range, not a single number - it signals you understand that metrics vary by bank type (PSU vs private), size, and credit cycle. Anchoring to HDFC Bank and SBI as reference points is always well-received.
Conclusion
Key banking metrics work best as a scorecard: NIM for profitability, CASA for funding strength, GNPA and NNPA for asset quality, PCR and credit cost for risk prudence, ROA and ROE for returns, and C/I Ratio for efficiency.
The most frequent error is quoting one banking metric in isolation or using a single number without a range. Always compare by bank type, size, and credit cycle - for example, private bank NIM benchmarks and PSU bank NIM benchmarks are not the same.