
Marketing Analytics Explained: Metrics and Applications
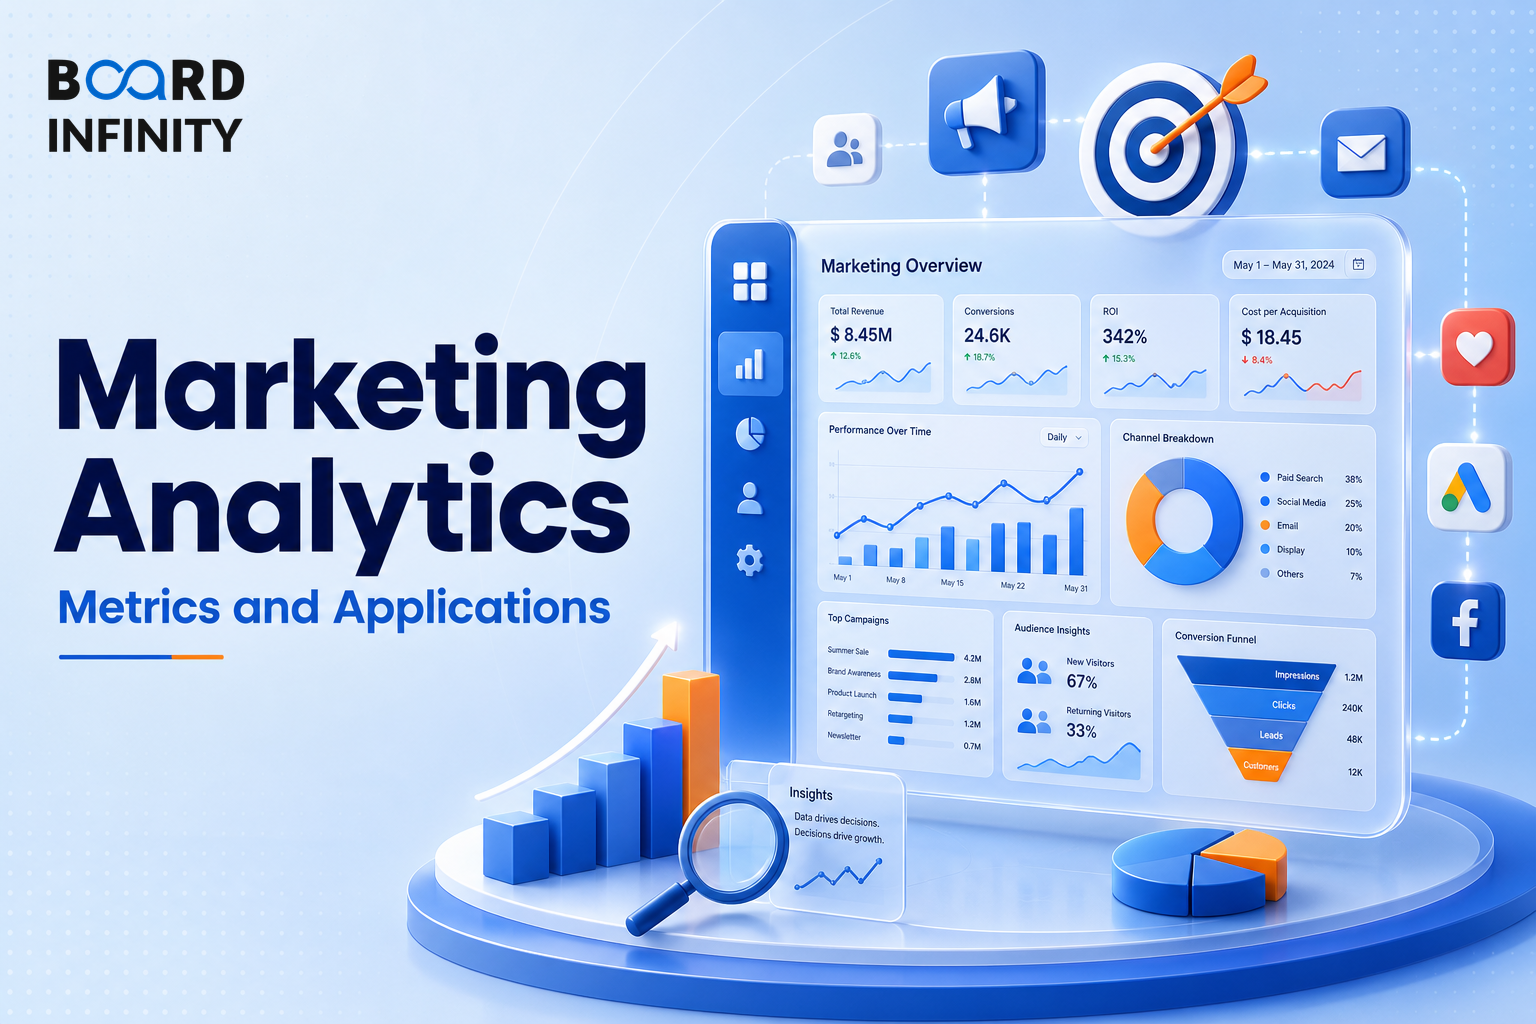
After Customer Analytics Explained: Metrics & Applications, marketing analytics answers the next question: which campaigns and channels acquire customers efficiently, convert them through the funnel, and create healthy unit economics. In interviews, this matters because candidates are often expected to connect formulas, India benchmarks, campaign profitability, and attribution choices into one business-ready answer.
- Customer Acquisition Cost (CAC) = Total Marketing Spend / New Customers Acquired; it tells you cost efficiency of acquisition channels.
- Return on Ad Spend (ROAS) = Revenue from Ads / Ad Spend; D2C brands target 3-6x and mature e-comm 4-8x.
- Click-Through Rate (CTR) = Clicks / Impressions × 100%; it shows ad creative and relevance effectiveness.
- Conversion Rate (CR) = Conversions / Total Sessions × 100%; it shows funnel and landing page effectiveness.
- LTV:CAC Ratio = Customer Lifetime Value / CAC; >3:1 good, >5:1 excellent, <1:1 unsustainable.
- Marketing Efficiency Ratio (MER) = Total Revenue / Total Marketing Spend; target is >3 as a blended metric across all channels.
- Data-Driven (DDA) attribution is ML-based attribution using actual conversion lift data, but requires large data (100K+ conversions) and can be a black box.
Marketing Analytics: The Big Picture
Marketing analytics connects two core views: performance metrics and attribution models. Performance metrics judge acquisition efficiency, ad campaign profitability, funnel and landing page effectiveness, unit economics health, overall marketing portfolio efficiency, list quality, and lead generation efficiency by channel.
Attribution models then decide how credit is assigned across touchpoints before conversion. This is where the choice between Last Click, First Click, Linear, Time Decay, Position-Based, and Data-Driven attribution changes how channels are evaluated.
Core Marketing Analytics Metrics
The most interview-ready way to discuss marketing analytics is to state the metric, give the formula, compare it to the India benchmark, and explain what the number tells you.
How to Read the Metrics Together
CAC, or Customer Acquisition Cost, measures the cost efficiency of acquisition channels. ROAS, or Return on Ad Spend, measures ad campaign profitability, while CTR, or Click-Through Rate, captures ad creative and relevance effectiveness.
CR, or Conversion Rate, explains funnel and landing page effectiveness. LTV:CAC Ratio connects Customer Lifetime Value to CAC and is a unit economics health metric - key for fundraising narrative.
MER, or Marketing Efficiency Ratio, gives an overall marketing portfolio efficiency view because it is a blended metric across all channels. Email Open Rate shows list quality and subject line effectiveness, while CPL, or Cost Per Lead, shows lead generation efficiency by channel.
Marketing Attribution Models
Attribution models decide how conversion credit is assigned across touchpoints. The model matters because the same campaign can look strong or weak depending on whether credit is assigned to the first touchpoint, the final touchpoint, every touchpoint equally, or actual conversion lift data.
Choosing the Right Attribution Lens
Last Click is simple and measurable, and is best for direct response where the final step is most important. Its weakness is that it ignores all prior touchpoints and undervalues awareness channels.
First Click gives 100% credit to the first touchpoint and values discovery/awareness, but ignores all subsequent touchpoints. Linear attribution acknowledges all channels by giving equal credit across all touchpoints, although treating all touchpoints equally is not realistic.
Time Decay gives more credit to touchpoints closer to conversion and is recency-weighted and intuitive. Position-Based (U-shaped) attribution gives 40% first + 40% last + 20% spread across middle, values both discovery and conversion, and is the most common balanced model in practice.
Data-Driven (DDA) attribution is ML-based attribution using actual conversion lift data. It is empirically accurate and handles multi-channel complexity, but requires large data (100K+ conversions) and can be a black box.
Structuring a Marketing Analytics Explained Interview Answer
"How would you evaluate whether a marketing campaign is performing well across acquisition efficiency, funnel performance, unit economics, and attribution?"
Candidates lose points when they quote a metric without the formula, benchmark, and what it tells you. A strong answer ties CAC, ROAS, CTR, CR, LTV:CAC, MER, and attribution into one business diagnosis.
The most frequent error is relying on Last Click because it is simple and measurable, while ignoring all prior touchpoints. This undervalues awareness channels and can make a balanced campaign look worse than it is.
Conclusion
Marketing analytics is an interview-ready toolkit for judging acquisition channels, ad profitability, funnel effectiveness, unit economics health, and attribution choices. The strongest answers combine formulas, India benchmarks, and a clear explanation of what each metric tells you.