
Operations & Supply Chain Analytics Explained
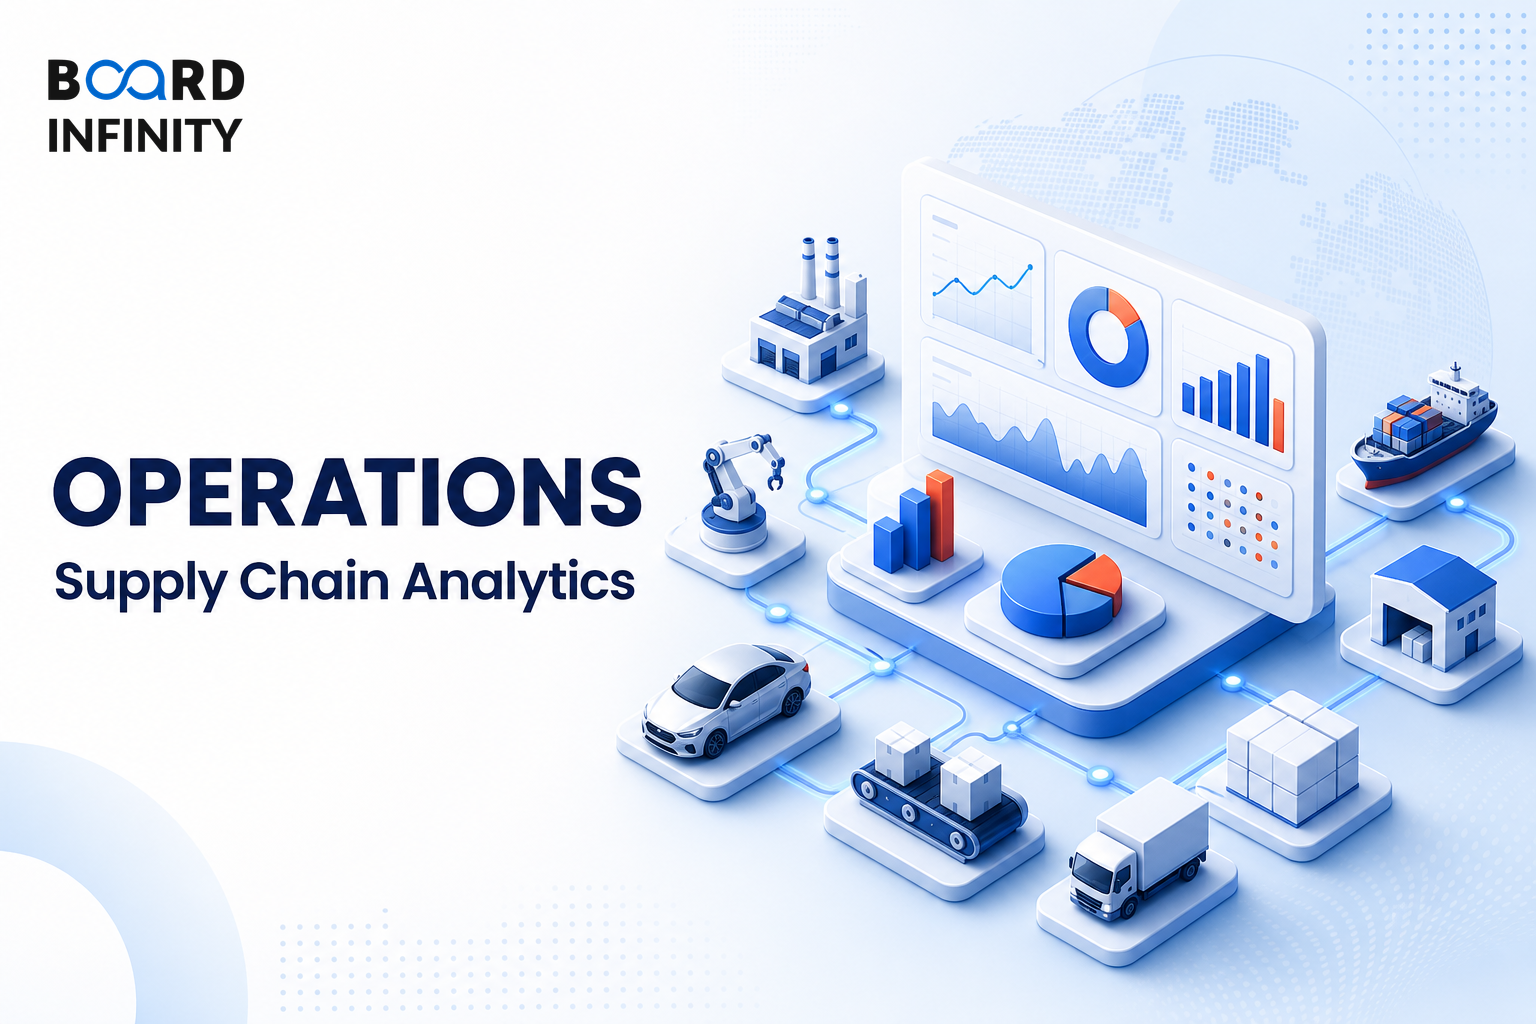
After Product Analytics Explained: Metrics & Applications, the next question is how analytics improves the operating system behind demand, inventory, routes, quality, suppliers, and last-mile delivery. Operations and supply chain analytics is a practical toolkit for forecasting demand, optimising inventory, routing deliveries, improving quality, and managing supplier risk using measurable outputs. In interviews, it helps you connect a business problem to a technique, a key output, and an Indian business example.
- Demand Forecasting uses ARIMA, Holt-Winters, XGBoost with lag features, and Facebook Prophet to create SKU-level weekly demand forecast with confidence intervals.
- Inventory Optimisation (EOQ) uses Economic Order Quantity = √(2DS/H) and safety stock = z × σ × √L to decide optimal order quantity, reorder point, and safety stock level.
- Route Optimisation uses Vehicle Routing Problem (VRP), linear programming, Google OR-Tools, and heuristics to create optimal delivery routes minimising distance/cost/time.
- Quality Analytics (SPC) uses Statistical Process Control, control charts (X-bar, R-chart), and Six Sigma DMAIC to track process capability, control limits, and defect rate.
- Supplier Analytics uses vendor scorecard, regression on delivery reliability, and classification on risk to produce supplier risk score, lead time prediction, and dual-source recommendations.
- Last-Mile Analytics uses geospatial clustering, time-window routing, and machine learning ETA to improve On-Time In-Full (OTIF) rate, ETA accuracy, and re-attempt prediction.
Operations & Supply Chain Analytics Overview
Operations and supply chain analytics connects each use case to a technique, a key output, and an Indian example. Economic Order Quantity (EOQ) means the order quantity that balances ordering and holding cost, Vehicle Routing Problem (VRP) is the routing optimisation problem, Statistical Process Control (SPC) monitors process quality using control charts, and On-Time In-Full (OTIF) measures orders delivered both on time and in full.
EOQ = √(2 × D × S / H)
D = Annual demand units, S = Ordering cost per order (₹), H = Holding cost per unit per year (₹)
Safety Stock = Z × σ_d × √(Lead Time)
Z = Service level z-score (1.65 for 95%), σ_d = demand std dev per period, LT = lead time in periods
OTIF % = Orders On-Time AND In-Full / Total Orders × 100%
Benchmark: Retail FMCG suppliers aim for >95% OTIF; poor OTIF leads to shelf-out-of-stock
Delhivery, India's largest logistics company, processes over 1 million shipments per day using OR-based route optimisation and ML-powered ETA prediction - saving an estimated ₹200+ crore annually in logistics costs compared to manual routing. Their algorithms consider 50+ variables including traffic patterns, time-of-day, pincode density, and historical delivery success rates.
Demand Forecasting Methods - Hierarchy
Demand forecasting can move from qualitative baseline methods to AI / ML methods depending on data availability, pattern complexity, and the need to include external variables. The hierarchy below shows the progression from expert judgment to feature engineering with advanced models.
Demand Forecasting
Demand Forecasting uses ARIMA, Holt-Winters, XGBoost with lag features, and Facebook Prophet. The key output is SKU-level weekly demand forecast with confidence intervals.
Reliance Retail forecasting 50,000 SKUs across 2,500 stores is the Indian example. In an interview answer, the useful structure is to show the business need, the forecasting technique, and the operational output that downstream inventory and replenishment teams can use.
Inventory Optimisation (EOQ)
Inventory Optimisation (EOQ) uses Economic Order Quantity = √(2DS/H); safety stock = z × σ × √L. The key output is optimal order quantity, reorder point, and safety stock level.
BigBasket managing 50,000+ grocery SKUs with dynamic EOQ is the Indian example. The practical point is that inventory analytics should not stop at a forecast - it should convert demand and uncertainty into order quantities and safety stock levels.
Route Optimisation and Last-Mile Analytics
Route Optimisation uses Vehicle Routing Problem (VRP), linear programming, Google OR-Tools, and heuristics. The key output is optimal delivery routes minimising distance/cost/time, with Delhivery optimising 1M+ daily delivery routes across India.
Last-Mile Analytics uses geospatial clustering, time-window routing, and machine learning ETA. The key output is On-Time In-Full (OTIF) rate, ETA accuracy, and re-attempt prediction, with Swiggy Instamart dark store placement and routing optimisation as the Indian example.
Quality Analytics (SPC) and Supplier Analytics
Quality Analytics (SPC) uses Statistical Process Control, control charts (X-bar, R-chart), and Six Sigma DMAIC. The key output is process capability (Cp, Cpk), control limits, and defect rate, with Tata Motors production quality monitoring on Chennai assembly line as the Indian example.
Supplier Analytics uses vendor scorecard, regression on delivery reliability, and classification on risk. The key output is supplier risk score, lead time prediction, and dual-source recommendations, with Hindustan Unilever supplier risk assessment across 1,500+ vendors as the Indian example.
Worked Example - Delhivery Route Optimisation
Delhivery processes over 1 million shipments per day. The problem is to create delivery routes that reduce logistics cost compared to manual routing while improving ETA prediction.
The framework uses OR-based route optimisation and ML-powered ETA prediction. The algorithms consider 50+ variables including traffic patterns, time-of-day, pincode density, and historical delivery success rates.
The decision output is optimal delivery routes minimising distance/cost/time and ETA accuracy. The outcome is saving an estimated ₹200+ crore annually in logistics costs compared to manual routing.
Structuring a Operations & Supply Chain Analytics Explained Interview Answer
"How would you apply operations and supply chain analytics to forecast demand, optimise inventory, route deliveries, improve quality, and manage supplier risk?"
The strongest answers do not list tools in isolation. They connect the use case to the technique, then to the key output, and then to a named Indian example.
The most frequent error is naming advanced techniques without explaining the operational output. In interviews, ARIMA, XGBoost, Google OR-Tools, control charts, or vendor scorecards only score well when they are tied to forecasts, order quantities, routes, defect rates, supplier risk scores, OTIF, or ETA accuracy.
Conclusion
Operations and supply chain analytics turns demand, inventory, routes, quality, suppliers, and last-mile delivery into measurable decisions. The final takeaway is simple: structure every answer as use case, technique, key output, and Indian example.