
Marketing Funnel Metrics Explained: End-to-End D2C and SaaS/B2B Funnels
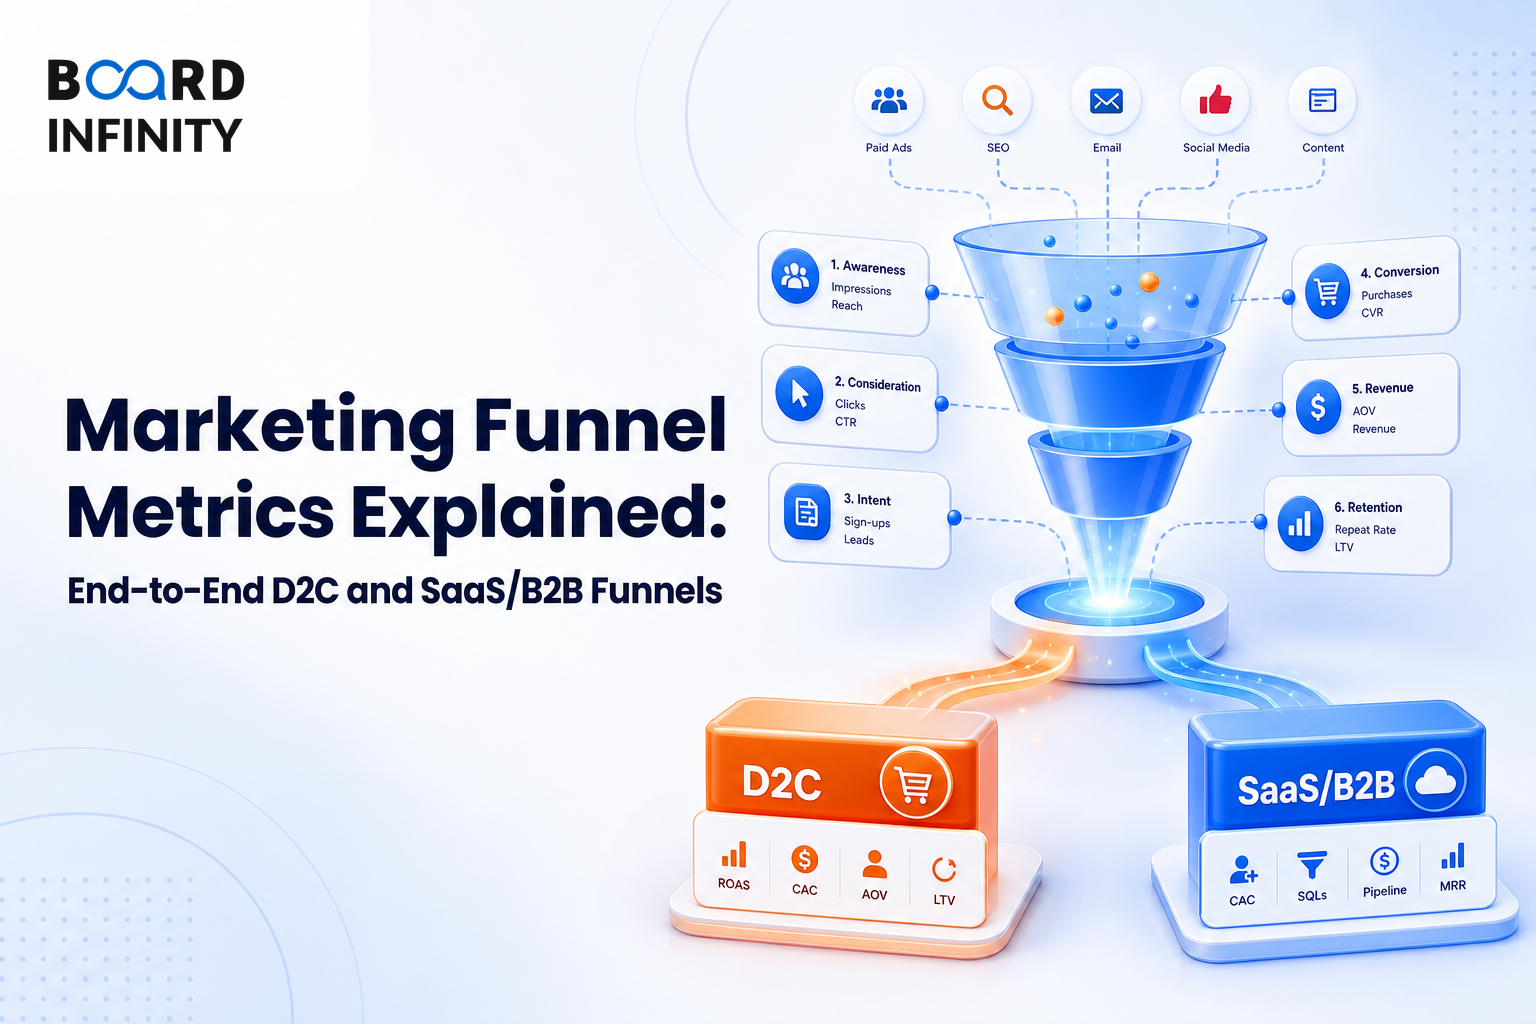
After the LTV:CAC Ratio, the next question is where that efficiency comes from inside the funnel. Every business has a funnel. The metrics change but the logic is the same: Volume × Conversion Rate = Output at each stage. In interviews, this helps you compare D2C e-commerce and SaaS/B2B funnels without mixing up stage-specific metrics.
- Every business has a funnel.
- The metrics change but the logic is the same: Volume × Conversion Rate = Output at each stage.
- In an e-commerce funnel, stages move from Traffic to Post-Purchase, with metrics such as Sessions, Bounce Rate, Add-to-Cart Rate, Cart Abandonment Rate, Conversion Rate, and Repeat Purchase Rate.
- In India D2C, Conversion Rate is benchmarked at 1.5-3%, while Repeat Purchase Rate is 25-35% in 90 days.
- In a SaaS / B2B funnel, stages move from Visitor → Lead to Overall, with metrics such as Visitor-to-Lead Rate, MQL Rate, SQL Rate, Opportunity Rate, Win Rate, and Lead-to-Close Rate.
- In SaaS / B2B, Overall Lead-to-Close Rate is benchmarked at 1-3% and tells you full funnel health; should improve over time.
Funnel Metrics as a Stage-by-Stage Equation
Every business has a funnel. The metrics change but the logic is the same: Volume × Conversion Rate = Output at each stage.
The big picture is simple: e-commerce funnels track behaviour from site traffic to repeat purchase, while SaaS / B2B funnels track movement from visitors to leads, qualified leads, opportunities, and closed deals.
Volume × Conversion Rate = Output at each stage.
E-commerce Funnel Metrics
The e-commerce funnel tracks each customer action from the first site visit to post-purchase repeat buying. Each stage has a metric, formula, benchmark, and optimisation lever.
How to Read the E-commerce Funnel
Traffic is measured through Sessions, defined as unique visits to site, with a benchmark focus on 100K+/month for scale. The optimisation levers are SEO, paid ads, social, influencers.
Engagement is measured through Bounce Rate, calculated as single-page sessions / total. A 40-55% is healthy benchmark points to page speed, mobile UX, relevant landing pages as optimisation levers.
Consideration is measured through Add-to-Cart Rate, calculated as add-to-cart events / sessions. The 8-12% benchmark connects directly to product images, reviews, pricing, urgency.
Intent is measured through Cart Abandonment Rate, calculated as carts abandoned / carts created. The 65-75% India avg benchmark makes checkout UX, COD option, trust badges, exit-intent offers important levers.
Purchase is measured through Conversion Rate, calculated as orders / sessions. The 1.5-3% India D2C benchmark links to payment options (UPI!), offers, shipping cost clarity.
Post-Purchase is measured through Repeat Purchase Rate, calculated as returning buyers / total buyers. The 25-35% in 90 days benchmark connects to Email/WhatsApp nurture, loyalty, product quality.
SaaS / B2B Funnel Metrics
The SaaS / B2B funnel tracks movement from visitors to leads, then through qualification and sales stages. Each metric shows a different part of funnel health.
How to Read the SaaS / B2B Funnel
Visitor → Lead is measured through Visitor-to-Lead Rate, benchmarked at 2-5%. It tells you landing page effectiveness; offer relevance.
Lead → MQL is measured through MQL Rate, benchmarked at 15-25%. It tells you lead quality; targeting accuracy.
MQL → SQL is measured through SQL Rate, benchmarked at 40-60%. It tells you sales-marketing alignment; lead scoring accuracy.
SQL → Opportunity is measured through Opportunity Rate, benchmarked at 60-70%. It tells you sales team qualification; product-market fit.
Opportunity → Close is measured through Win Rate, benchmarked at 20-30%. It tells you sales effectiveness; competitive positioning.
Overall is measured through Lead-to-Close Rate, benchmarked at 1-3%. It tells you full funnel health; should improve over time.
D2C E-commerce vs SaaS / B2B Funnel Metrics
The logic stays the same across both funnels: Volume × Conversion Rate = Output at each stage. The difference is in the stage names, metrics, benchmarks, and what those metrics diagnose.
Structuring a Marketing Funnel Metrics Explained Interview Answer
"Every business has a funnel. How would you explain funnel metrics end-to-end for e-commerce and SaaS/B2B?"
Do not give only one overall conversion number. Tie each stage to its own metric, benchmark, and what it tells you.
The most frequent error is treating funnel metrics as isolated numbers instead of using Volume × Conversion Rate = Output at each stage. In D2C e-commerce, that misses stage-specific optimisation levers; in SaaS / B2B, it misses what each rate tells you.
Conclusion
Marketing funnel metrics explain how output is created stage by stage. The metrics differ across D2C e-commerce and SaaS / B2B, but the core logic remains the same: Volume × Conversion Rate = Output at each stage.