
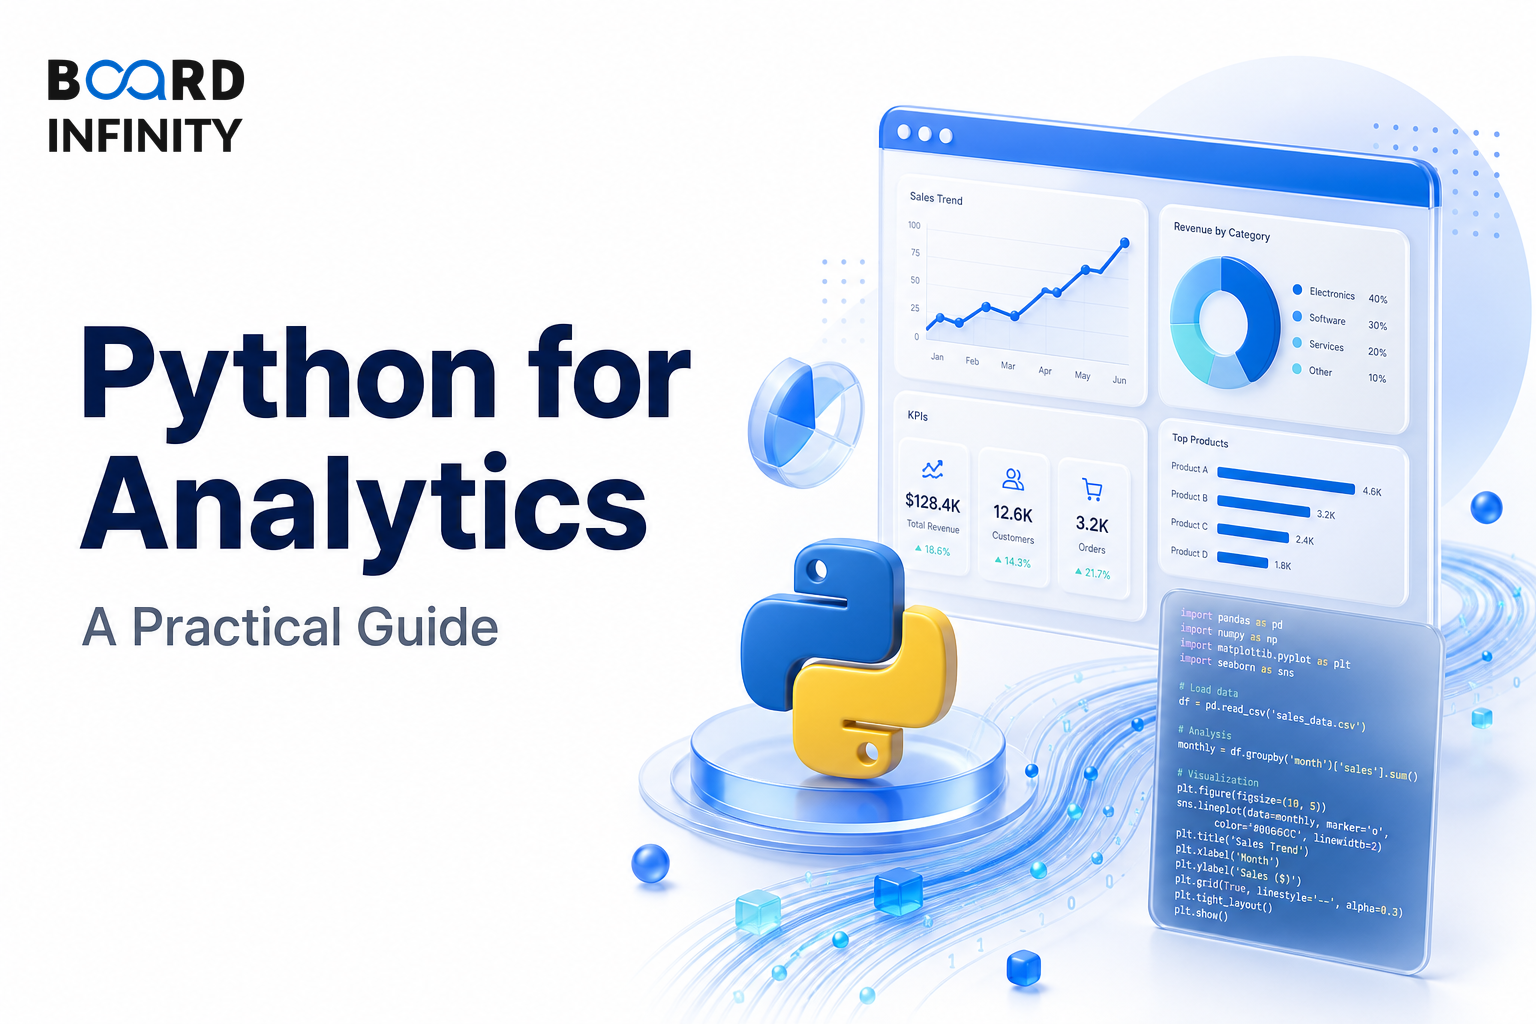
Python for Analytics: A Practical Guide is a structured track of 6 lessons that build a complete, interview-ready understanding of the topic. Work through them in order, then use the quiz and flashcards in each lesson to revise.
What this course covers
- The Python Analytics Stack Explained - NumPy Array maths → Pandas DataFram es → Matplotli b Seaborn Static viz → Plotly Interactiv e viz → Scikit-le arn ML models → Statsmo dels Statistics → Scipy Sci comp uti
- Pandas for Data Manipulation: A Practical Guide - Interview Favourite: 'Show me how you'd do a GROUP BY in pandas' - tests SQL↔pandas translation ability Operation Pandas Method SQL Equivalent Example Code Read data pd.r
- Data Visualization with Python: Matplotlib, Seaborn & Plotly - Library Best For Chart Types Interactivity Learning Curve Matplotlib Static, publication-quality, maximum customisation All standard types + custom None (static) High - v
- Statistical Analysis with Python Explained - Analysis Library Function Indian Business Example Two-sample t-test scipy.stats ttest_ind(group_a, group_b) Did Paytm feature rollout increase avg transaction value?
- Python vs R: When to Use What for Analytics - Dimension Python R Learning Curve Moderate - general purpose language Steeper for beginners - domain-specific Primary Strength Full-stack: data + web + ML + deployment St
- An End-to-End Python Analytics Workflow - New Section: The Complete Analytics Pipeline - From raw data to business insight, every step with code patterns.