
An End-to-End Python Analytics Workflow
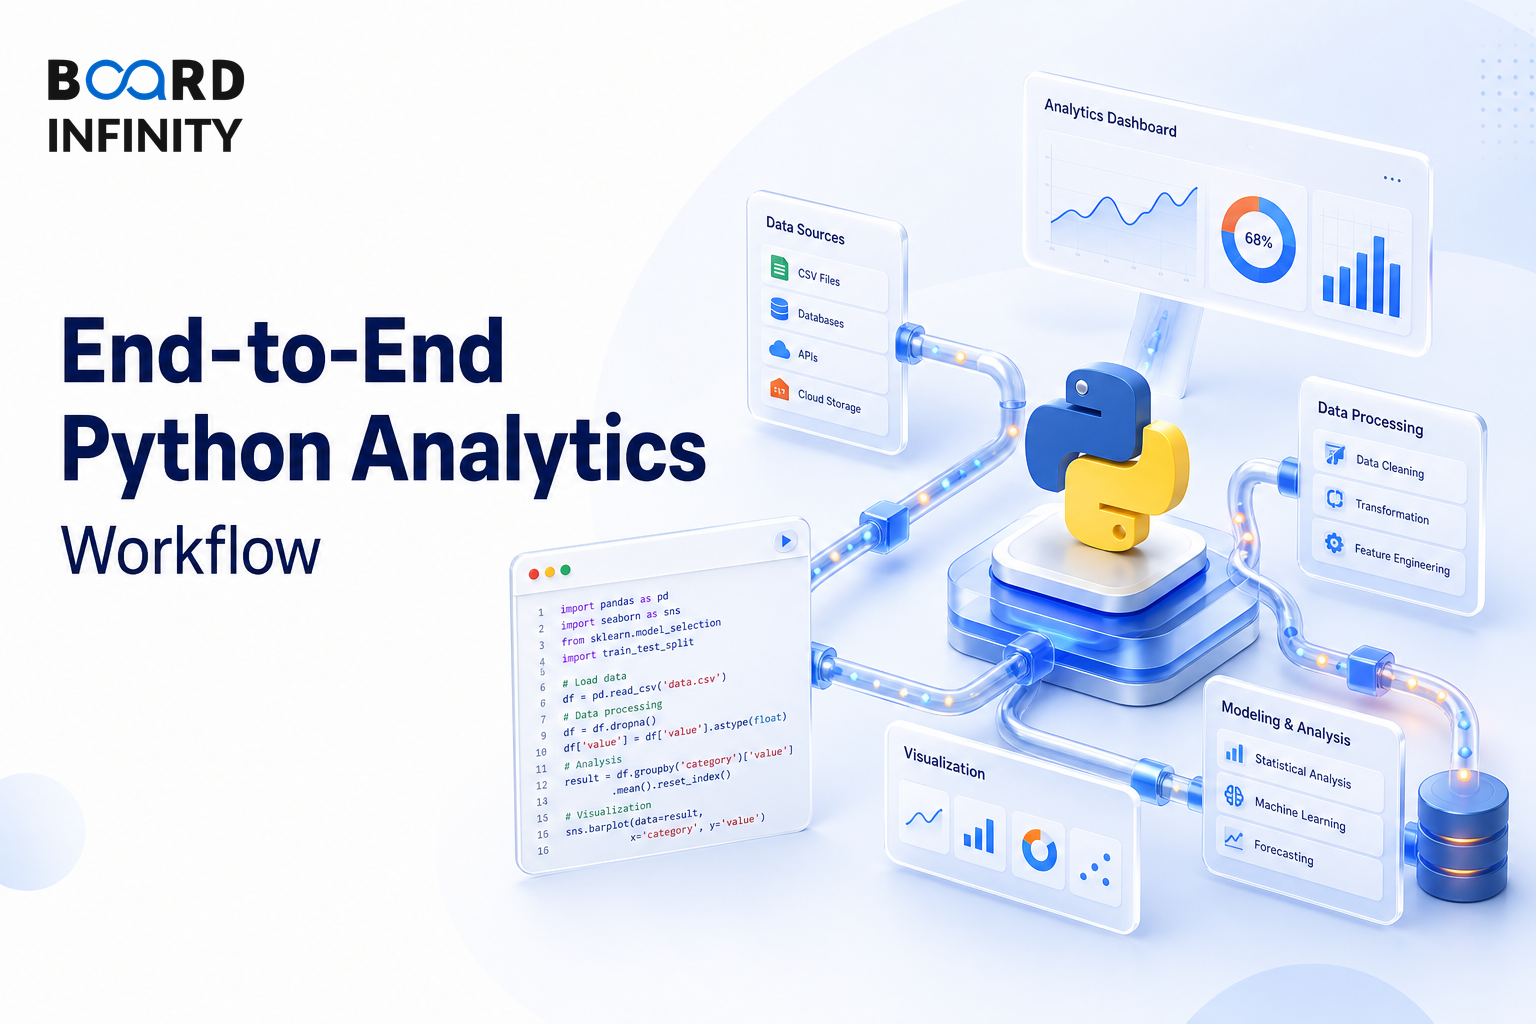
After choosing between Python vs R for analytics, the next interview question is practical: how do you turn raw data into a business recommendation? This workflow answers that question end-to-end using messy restaurant data, pandas, statistics, visualisation, and communication. In interviews, the strongest answers show the full path from problem definition to insight plus action, not just isolated code snippets.
- The end-to-end Python analytics workflow is Raw Data → EDA → Cleaning → Feature Engineering → Analysis → Visualisation → Communication.
- The worked example is analysing Zomato restaurant data across Indian cities to identify factors driving high restaurant ratings.
- Exploratory Data Analysis, or EDA, uses shape, describe, info, distributions, value counts, histograms, and missing-value checks.
- Data cleaning drops missing target variables, converts ₹ strings to numeric values, imputes missing costs with city median, removes invalid ratings, and removes outliers using the IQR method.
- Feature engineering creates has_delivery, price_tier, cuisine_count, and is_high_rated for better analysis.
- Analysis uses groupby, correlation, and statistical testing; visualisation uses bar charts and heatmaps; communication uses insight plus action.
The Complete Analytics Pipeline
The complete analytics pipeline moves from raw data to business insight, every step with code patterns. For the Zomato example, the business problem is: what factors predict high restaurant ratings on Zomato across Indian cities?
Zomato: The Full Framework in One Business
Zomato demonstrates the full workflow because the data contains restaurants across Indian cities, ratings, costs, cuisines, delivery, votes, and city-level variation. The goal is to identify factors driving high restaurant ratings.
A shallow answer stops at loading and plotting. A complete answer connects every step to a final business recommendation.
KEY INSIGHT: Luxury and Premium restaurants rate 0.7 points higher than Budget; votes (engagement proxy) is the strongest predictor (r=0.42, p<0.001). RECOMMENDATION: Zomato should prioritise promoting high-vote restaurants; premium restaurants can charge more AND deliver better ratings.
Step 1-3: Problem Setup, Data Loading and EDA
The first three steps set up the analysis before any cleaning or modelling happens. The problem is clearly stated: what factors predict high restaurant ratings on Zomato in Indian cities?
Exploratory Data Analysis, or EDA, is where the analyst checks size, types, summary statistics, distributions, and missingness. In this example, the EDA already reveals scale, city concentration, dominant cuisine, rating distribution, and the missing-value problem that must be cleaned before analysis.
Step 4-5: Data Cleaning and Feature Engineering
Cleaning makes the dataset reliable enough for analysis. Feature engineering creates new columns that represent business meaning more directly than the raw fields.
The Interquartile Range, or IQR, method uses Q1 and Q3 to remove outliers outside Q1 - 1.5*IQR and Q3 + 1.5*IQR. In the Zomato workflow, this is applied to cost_for_two after converting it into a numeric field.
Step 6-8: Analysis, Visualisation and Communication
Once the dataset is clean and features are ready, the workflow moves into analysis, visualisation, and communication. This is where the Python work becomes a business recommendation.
The analysis result is clear: Luxury and Premium restaurants rate 0.7 points higher than Budget, and votes is the strongest predictor with r=0.42 and p<0.001. The recommendation follows directly: Zomato should prioritise promoting high-vote restaurants, and premium restaurants can charge more and deliver better ratings.
Why pandas Fits This Workflow
Python's pandas library was created by Wes McKinney in 2008 while he was working at AQR Capital Management - a hedge fund. The name comes from 'panel data', an econometrics term for multi-dimensional data involving measurements over time.
India now has over 4 million Python developers - the 3rd largest Python developer community globally. For this workflow, pandas is the primary tool for loading, cleaning, grouping, transforming, and analysing tabular restaurant data.
Structuring a An End Interview Answer
"Walk me through an end-to-end Python analytics workflow to identify what factors predict high restaurant ratings on Zomato in Indian cities."
The strongest answer does not jump straight to charts or machine learning. It shows how the question, EDA, cleaning, feature engineering, analysis, visualisation, and communication connect to one business recommendation.
The most frequent error is treating the workflow as a coding sequence instead of an insight pipeline. If you skip problem definition, cleaning, or communication, the analysis may look technical but it will not explain what action Zomato should take.
Conclusion
An end-to-end Python analytics workflow turns raw restaurant data into insight plus action by moving through problem definition, loading, EDA, cleaning, feature engineering, analysis, visualisation, and communication. For interviews, the final takeaway is simple: show the full pipeline and connect every code pattern to the business recommendation.