
Statistical Analysis with Python Explained: scipy and statsmodels Testing Cheat Sheet
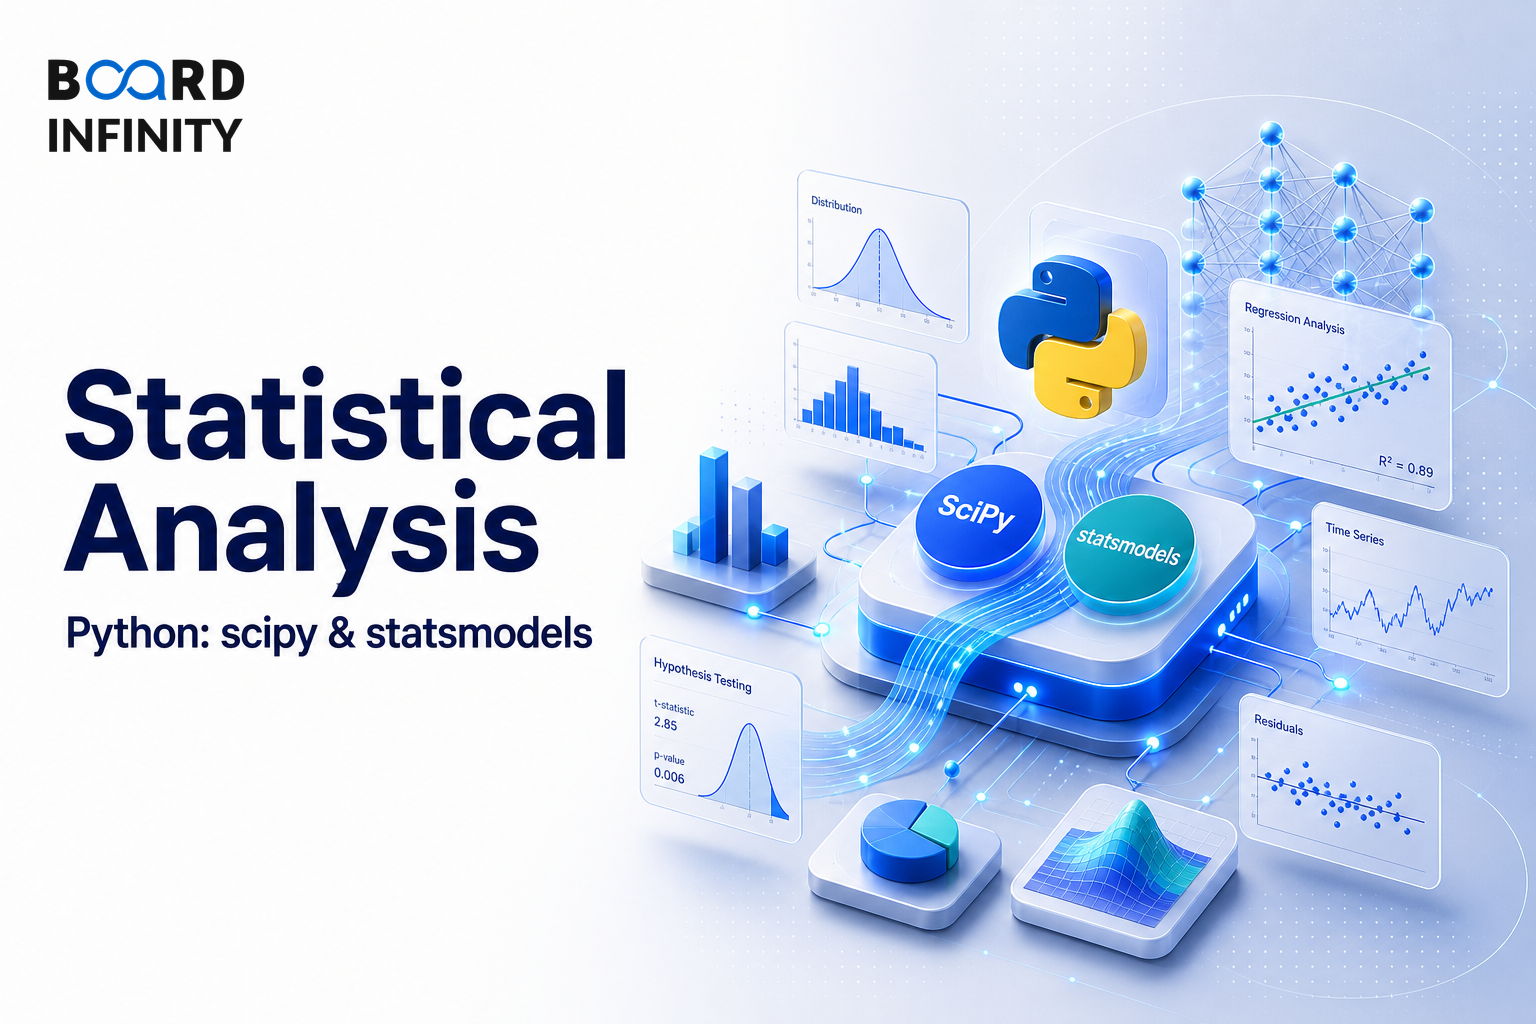
After Data Visualization with Python: Matplotlib, Seaborn & Plotly, the next question is what to do when a chart suggests a difference, relationship, or trend. Statistical analysis with Python helps convert those business questions into the right test, library, and function. For interviews, this matters because you are often expected to map a practical analytics problem to the correct scipy.stats or statsmodels method without overcomplicating the answer.
- Use Two-sample t-test with scipy.stats and
ttest_ind(group_a, group_b)for questions like: Did Paytm feature rollout increase avg transaction value? - Use Chi-square association test with scipy.stats and
chi2_contingency(contingency_table)when asking: Is payment method independent of user city tier? - Use Mann-Whitney U with scipy.stats and
mannwhitneyu(a, b, alternative='two-sided')for non-parametric comparisons like Swiggy delivery times: Bengaluru vs Mumbai. - Use Correlation (Pearson / Spearman) with scipy.stats and
pearsonr(x,y)/spearmanr(x,y)for relationship questions like ad spend and conversion rate. - Use Linear Regression (statsmodels) with statsmodels and
OLS(y, sm.add_constant(X)).fit()to predict e-commerce revenue from marketing spend. - Use Time series decomposition and ARIMA forecasting with statsmodels for Zomato weekly order volumes and next month's Nykaa revenue.
Statistical Analysis with Python: The Big Picture
Statistical analysis in Python is a practical mapping exercise: identify the business question, choose the analysis type, pick the library, and call the matching function. The most common interview-ready split is between scipy.stats for statistical tests and correlation, and statsmodels for regression, proportion tests, time series decomposition, and ARIMA forecasting.
Hypothesis Testing Flow
When the business question is about testing a claim, use a clear hypothesis testing flow before jumping into code. This keeps the answer structured and prevents choosing a function only because it looks familiar.
Choosing scipy.stats for Tests and Relationships
scipy.stats is used here for the Two-sample t-test, Chi-square association test, Mann-Whitney U, and Correlation (Pearson / Spearman). These cover common interview prompts where the analyst must compare groups, test association between categorical variables, or measure relationships between numerical variables.
For a Paytm feature rollout question, the relevant function is ttest_ind(group_a, group_b). For the question, "Is payment method independent of user city tier?", the relevant function is chi2_contingency(contingency_table). For a Swiggy delivery time comparison between Bengaluru and Mumbai where a non-parametric approach is needed, the relevant function is mannwhitneyu(a, b, alternative='two-sided').
Choosing statsmodels for Regression, A/B Tests, and Time Series
statsmodels is used here for Linear Regression, A/B test proportion test, Time series decomposition, and ARIMA forecasting. These are business-facing methods where the question is often about prediction, conversion improvement, decomposition, or forecasting.
For predicting e-commerce revenue from marketing spend, use OLS(y, sm.add_constant(X)).fit(). For testing if a new checkout page improves conversion rate, use proportions_ztest([conv_a, conv_b], [n_a, n_b]). For time series questions, use seasonal_decompose(series, model='multiplicative') to decompose Zomato weekly order volumes and ARIMA(series, order=(p,d,q)).fit() to forecast next month's Nykaa revenue.
Distribution Check Before Choosing a Test
Indian startup data - Swiggy delivery times, Zomato ratings, UPI transaction values - is almost NEVER normally distributed. Distribution plots show heavy right skew, zero-inflation, and multi-modality.
Blindly applying t-tests to such data produces misleading p-values. Always check with a histogram or Shapiro-Wilk test before choosing your test.
Parametric vs Non-parametric Choice
The Mann-Whitney U row is important because not every comparison should use a t-test. When the data is non-normal or ordinal, the non-parametric equivalent becomes the safer choice for the question being asked.
Correlation Needs Extra Care
Correlation (Pearson / Spearman) is useful for the relationship between ad spend and conversion rate, but it should not be treated as proof of cause and effect. The #1 Analytics Mistake is confusing correlation with causation. Always ask: "Is there a lurking (confounding) variable?"
Blindly applying t-tests to non-normal data produces misleading p-values. If interviewer gives you non-normal data and you apply t-test, you'll be penalised. Always check distribution first.
Conclusion
Statistical Analysis with Python is about matching the business question to the right scipy.stats or statsmodels function. In interviews, the strongest answers start with the question type, check the assumptions, choose the test, and then connect the result back to a business example like Paytm, Swiggy, Zomato, or Nykaa.