
Case: Diagnosing and Fixing a Manufacturer's Falling Margins

The factory floor looks busy, trucks are leaving on time, and sales are higher than last quarter - yet the CFO’s face drops when the margin report opens. That is the classic manufacturing trap: revenue can rise while profit leaks through raw material inflation, discounting, poor mix, idle capacity, scrap, or slow-moving inventory.
- Do not start with cost cutting. First isolate whether the fall is from price, volume, mix, variable cost, fixed cost absorption, or working capital.
- Use a margin bridge: Revenue change explains growth, but margin rate change explains quality of growth.
- Manufacturing margin diagnosis usually starts at gross margin because raw materials, labor, scrap, energy, freight, and production efficiency hit here first.
- Separate controllable from uncontrollable drivers: commodity inflation may be external; discounting, scrap, mix, procurement, and capacity utilization are managerial levers.
- Fixes must match root cause: input inflation needs pricing and hedging; poor mix needs product push; low utilization needs volume, consolidation, or outsourcing.
- The strongest answer quantifies impact: “₹36 crore gross profit decline, of which ₹66 crore came from margin-rate deterioration partly offset by ₹30 crore from higher sales.”
- Final recommendation must balance margin and market share: a price hike that destroys volume may worsen operating leverage.
Big Picture: A Falling Margin Is a Leak, Not a Mystery
Think of a manufacturer’s profit as a funnel. Revenue enters at the top, but every stage has possible leaks - discounts reduce price realization, expensive inputs compress gross margin, idle plants hurt fixed cost absorption, and excess inventory converts accounting profit into weak cash.
Core Explanation: The Price-Volume-Mix-Cost Diagnosis
The cleanest way to crack a falling-margin manufacturing case is to build a margin bridge. It separates the business into six drivers: selling price, volume, product mix, variable cost, fixed cost absorption, and one-offs or accounting effects.
The Margin Bridge: What Changed and Why
A margin bridge prevents vague answers like “costs increased.” It tells the interviewer exactly how much of the decline came from growth quality, pricing discipline, cost inflation, and operating leverage.
A Worked Example You Can Speak in a Case
Suppose a component manufacturer grew revenue from ₹1,000 crore to ₹1,100 crore, but gross margin fell from 30% to 24%.
The spoken diagnosis: “Revenue growth added ₹30 crore of gross profit, but margin-rate deterioration removed ₹66 crore, so gross profit fell by ₹36 crore. I would next split the ₹66 crore into price realization, raw material cost, mix, yield, and plant utilization.”
Metrics to Track in a Manufacturing Margin Case
Use metrics that connect financial symptoms to operating causes. Benchmarking must be against the company’s own trend and comparable peers because a steel maker, paint company, auto component supplier, and electronics assembler naturally have different margin structures.
The Root-Cause Map: Match Symptom to Driver
Falling margins usually come from one of four zones. A complete answer checks all four before recommending action.
Definitions You Should Be Able to Say Cleanly
- Gross margin: Revenue minus cost of goods sold, divided by revenue.
- EBITDA margin: Earnings before interest, tax, depreciation and amortization, divided by revenue.
- Contribution margin: Selling price minus variable cost, expressed per unit or as a percentage of selling price.
- Operating leverage: The sensitivity of operating profit to revenue changes because fixed costs do not move proportionately.
- Porter value chain lens: Disaggregate the firm into strategically relevant activities to understand cost behavior and differentiation.
Case Study: Pidilite and the Margin Pressure of Input Inflation
Pidilite shows how a branded manufacturer can protect margins when crude-linked inputs rise, but only by combining pricing power with mix, procurement, and execution.
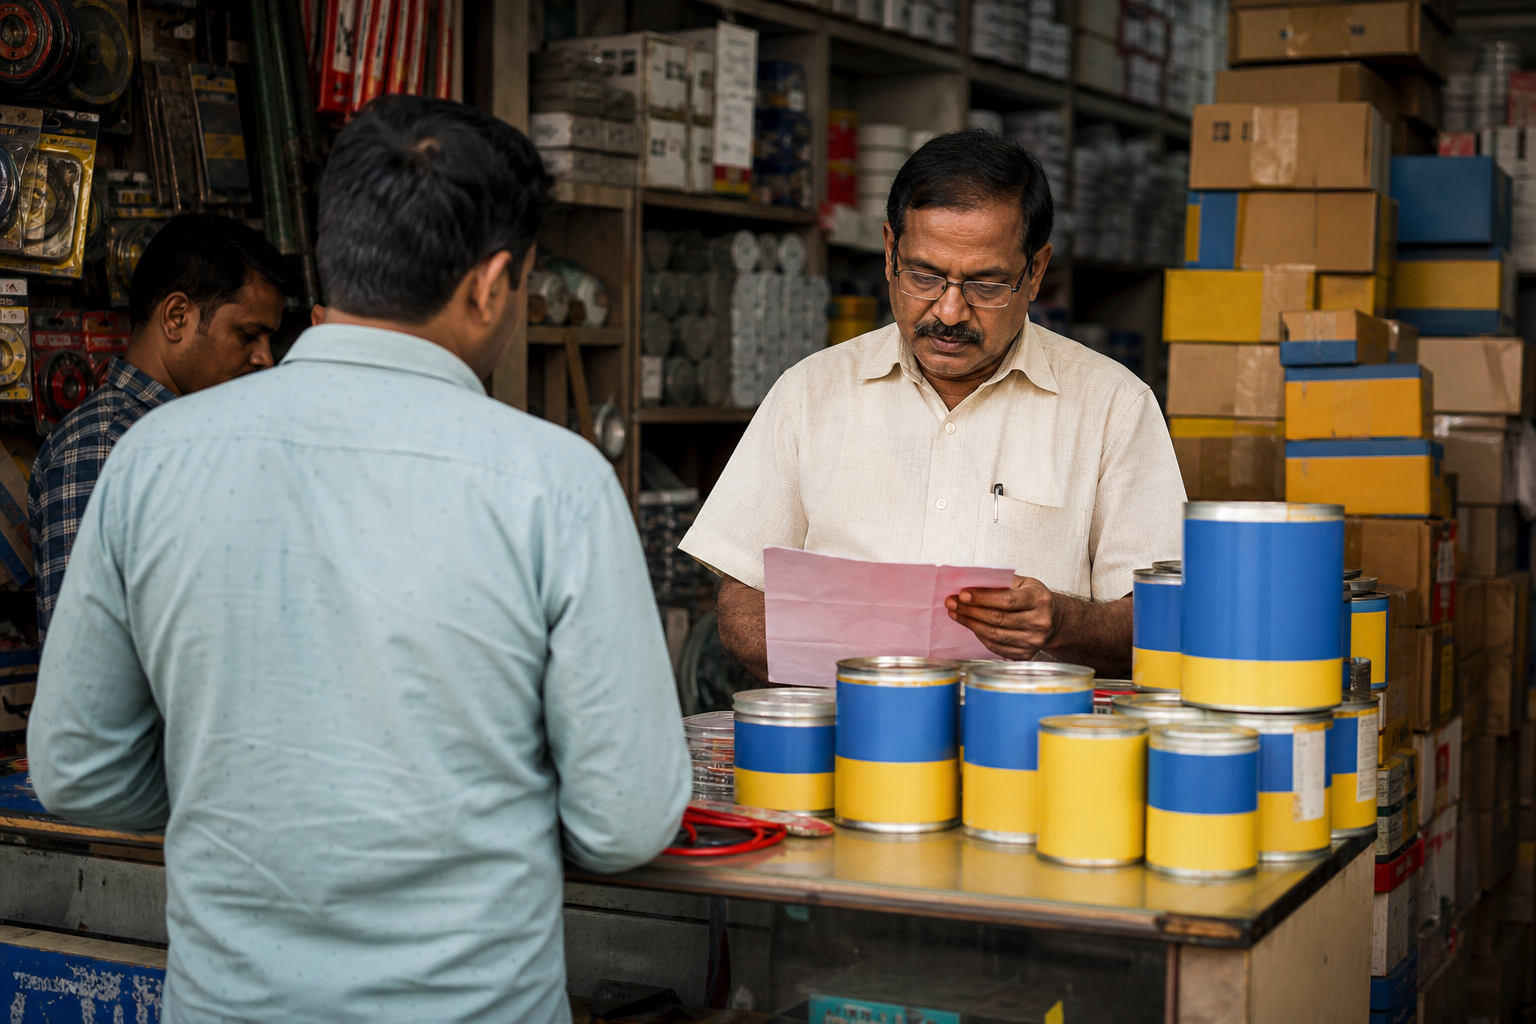
Situation: Pidilite, known for adhesives, construction chemicals, and industrial products, has faced periods where input costs rose sharply. For adhesive manufacturers, key raw materials and packaging can be linked to chemical and crude-oil value chains, so procurement shocks can compress gross margin before price hikes fully pass through.
The move: The company’s response was not a single lever. The primary driver was pricing power built through strong brands and distribution, allowing calibrated price increases. Supporting drivers included product premiumization, mix improvement toward stronger categories, procurement discipline, operating efficiency, and continued reach through India’s dealer and contractor ecosystem.
Outcome or lesson: The lesson is powerful for case interviews: a manufacturer with strong brands can recover margins faster than a commodity player, but even pricing power has a lag. A complete margin fix needs price realization, cost control, mix management, and execution in the channel.
The strategic “so what”: Pidilite’s margin resilience is chiefly driven by brand-led pricing power, supported by distribution depth, category mix, procurement discipline, and operational execution. That is the kind of multi-driver explanation interviewers trust.
How AI Changes Diagnosing and Fixing a Manufacturer's Falling Margins
AI makes margin diagnosis faster, but not automatic. The consultant still needs commercial judgment; AI improves the speed and granularity of the analysis.
- SKU-level margin anomaly detection: ML models can flag which SKUs, plants, customers, or channels caused the margin drop instead of forcing analysts to manually scan hundreds of rows.
- Predictive cost and procurement analytics: AI can combine commodity prices, supplier lead times, freight indicators, and purchase contracts to forecast input-cost pressure before it hits the P and L.
- Digital twins for plant performance: Manufacturers can simulate yield, downtime, energy usage, throughput, and changeover time to test which operational fix improves margin most.
Use NotebookLM: upload the company annual report, investor presentation, and a transcript of the latest earnings call. Ask: “Create a margin bridge hypothesis by segment, separating price, volume, mix, raw material cost, operating leverage, and one-offs. List five interview questions I should ask before recommending a fix.”
Interview Relevance
“A manufacturing company’s revenue grew 12%, but EBITDA margin fell from 15% to 10%. Diagnose the problem and recommend how management should fix it.”
Always say, “I will first check whether profit fell in rupees or only margin percentage fell.” If revenue grows fast, margin percentage may fall even while absolute profit rises - that leads to a different recommendation.
Common Mistake
The biggest mistake is jumping straight to “increase prices and cut costs” without diagnosing the margin bridge. It costs candidates because the recommendation may solve the wrong problem - for example, raising price when the real issue is adverse product mix or plant downtime. Fix: always split the decline into price, volume, mix, variable cost, and fixed cost absorption before recommending action.
What to Revise Next
Once you can diagnose a manufacturer’s margin decline, move to adjacent business judgment cases where the same financial logic becomes strategic decision-making.