India Reference Sheet FY26 - Population, Households and Income Anchors
Most India market-sizing answers fail not because the structure is poor, but because the starting anchors are unrealistic. This FY26 reference sheet gives you the memorisable numbers to begin with: population, households, age groups, income percentiles and macro checks. In interviews, these anchors help you avoid inflated total addressable markets, weak affordability assumptions and crore-million conversion errors.
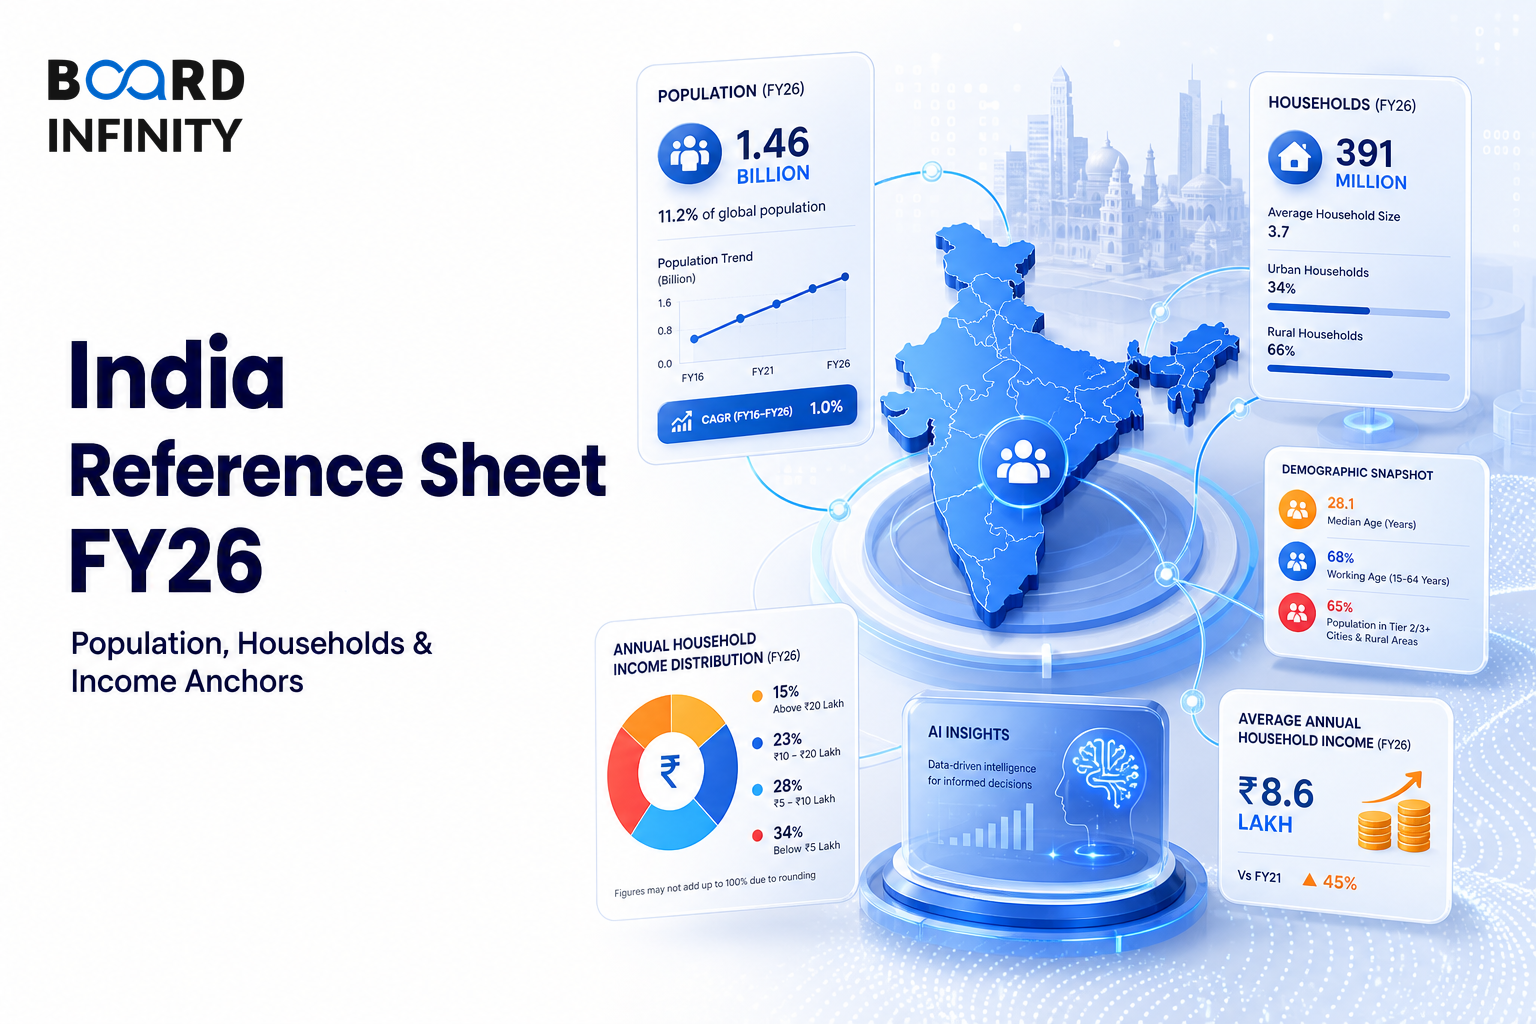
- Use 140 cr or 145 cr as the rounded India population anchor, depending on how clean you want the math to be.
- Average household size is 4.6, with urban at 4.2 and rural at 4.8, so India has roughly 32 cr households.
- The working-age population, meaning ages 15-59, is about 95 cr or 66%, making it the first labour-force and consumer-base filter.
- Income distribution matters more than averages: median per-capita income is about ₹1.6 lakh, while per-capita GDP is about ₹2.45 lakh.
- For premium sizing, use top 10% household income greater than ₹15 lakh/year; for luxury, use top 1% greater than ₹50 lakh/year.
- Nominal GDP is about ₹350 lakh cr or USD 4.1 tn, and FMCG is about ₹19 lakh cr, useful as macro sense-checks.
- Never confuse Indian and Western units: 1 crore = 10 million, 100 crore = 1 billion and 1 lakh crore = 1 trillion.
Read this sheet as a layered sanity-check system: start with people, convert to households, filter by income, then compare against macro, sector and unit anchors.
Population and Household Anchors
The cleanest India sizing base is population first, households second. The source recommends rounding India population to the nearest 5 crore, using 140 cr or 145 cr, because the difference is less than 2% and is rarely material in an interview estimate.
Households are the better base for appliances, utilities, housing, financial products and media reach. Average household size is 4.6, with 4.2 in urban India and 4.8 in rural India. Using the population divided by household cross-check, 145 cr ÷ 4.6 gives roughly 32 cr households.
For India household estimates, start with population, divide by average household size, then apply urban or rural split only if the product is location-sensitive.
The nuance is that household size is not constant across India. Urban products should use the 4.2 urban household size, while rural-heavy products should use 4.8. In many guesstimates, using the overall 4.6 is acceptable, but switching bases mid-calculation without saying so creates avoidable inconsistency.
Age and Life-Cycle Anchors
Age filters convert a large population base into a relevant consumer or user base. Working-age population refers to people aged 15-59, while children are aged 0-14 and seniors are aged 60+. These buckets are useful because many categories are life-stage driven rather than universally consumed.
For example, a baby-care estimate should not begin with 145 cr people. It should begin with annual births of about 2.3 cr, then layer in product penetration, frequency and price. Similarly, a retirement-healthcare or pension product should begin closer to the 12 cr seniors base, not the full adult population.
Income Anchors and Affordability Filters
Income distribution is the most under-used data point in Indian guesstimates. The source explicitly warns against the assumption that "60% of urban India earns ₹50k/month+" because the reality is about 20% of urban households. That error alone can inflate an answer by roughly 3x.
GDP means gross domestic product, the total value of goods and services produced in the economy. Per-capita GDP divides GDP by population, while median per-capita income is the income level at the middle of the distribution. In affordability questions, the median is often a more realistic spending anchor than the average.
TAM means total addressable market, the maximum revenue opportunity if a product could serve its entire relevant market. ITR means income tax return; the FY24 ITR count of about 9 cr is useful when a product is linked to formal income, documented earnings or tax-paying customers.
For mass products, anchor on median income and bottom 50% household income. For premium products, start with top 10% households. For luxury products, start with top 1% households.
The key nuance is that per-capita GDP and median income answer different questions. Per-capita GDP helps macro benchmarking, but median income is usually better for estimating realistic spending by ordinary consumers. For premium goods, the top 10% household-income threshold of greater than ₹15 lakh/year is a stronger filter than a generic urban population assumption.
Worked Example - Correcting an Urban Premium Market Assumption
This is the exact kind of correction that wins points in a case interview. The structure stays simple: urban population, household conversion, income filter and then category-specific penetration or spend. The outcome is not just a number; it is a more credible market boundary.
City Tier Reference for Urban Sizing
City tier here means population size, not a ranking of importance. Indian planning often uses this taxonomy for census and Reserve Bank of India publications. Use it when a product is urban but not uniformly distributed across all towns.
The mistake to avoid is treating "urban India" as only the six megacities. Megacities add up to about 12 cr, while total urban India is about 54 cr. Depending on the product, the relevant market may sit in large metros, mid-sized cities or the long tail of towns.
Digital, Devices and Mobility Anchors
Once the population and income base is realistic, digital and mobility anchors help test access and usage. UPI means Unified Payments Interface, India’s digital payments system. OTT means over-the-top media services delivered through the internet, and fintech means technology-led financial services.
The nuance is that access metrics are not the same as paying users. Internet users at about 95 cr and smartphone users at about 80 cr are large, but income and frequency still decide revenue. Similarly, active mobile connections at about 115 cr reflect multi-SIM ownership, so they should not be treated as unique individuals.
Sector and Penetration Anchors
Sector anchors are useful when your bottom-up estimate needs a top-down ceiling. FMCG means fast-moving consumer goods, such as frequently purchased packaged consumer products. BFSI means banking, financial services and insurance, while GMV means gross merchandise value, the total value of goods sold through a commerce platform before adjustments.
Penetration rates then help you avoid assuming universal ownership. Bank account ownership is about 85% of adults, but only about 50% are active. LPG connection penetration is about 98% of households, while car ownership is about 10% of households and air conditioner penetration is about 12% of households.
Crore-Lakh-Million-Billion Shortcut
Unit conversion is a scoring issue in guesstimates because a correct structure can still fail if the final magnitude is off. The source notes that this table prevents 30% of all unit-conversion errors in interviews. The core rule is simple: 1 crore = 10 million and 1 lakh crore = 1 trillion.
To move between Indian and Western magnitudes, remember that 1 crore is 10 million and 100 crore is 1 billion. Practice until it is automatic because interviewers do not pause for unit conversions.
Service Density Sanity Checks
Density ratios help you validate whether a bottom-up answer is high, low or in range. The method is to convert your estimate into a per 100,000 people number, then compare it with a known density. This is especially useful for healthcare, banking, policing, schools, pharmacies and public infrastructure.
Use this line in interviews: My estimate of X comes to Y per 100,000 people, versus the established density of Z, so it is high, low or in range because of the category context.
Rounding Rules for Fast Mental Math
Speed matters because a guesstimate usually rewards defensible structure more than decimal precision. The source recommends finishing a guesstimate in 8-10 minutes by rounding intelligently and avoiding fake precision. Round once at the start or once at the end, but do not keep rounding mid-calculation.
A useful mental shortcut is percentage flipping: X% of Y = Y% of X. For example, 16% of 25 = 25% of 16 = 4. For common shares, 25% is divide by 4, 33% is divide by 3 and 75% is the original number minus one-fourth.
The most frequent error is using a large India base and skipping the income filter. It leads candidates to treat urban population, internet users or smartphone users as paying customers, which can overstate premium markets by multiples. Always convert people to households where relevant, then apply affordability before penetration.
Conclusion
Use this FY26 India reference sheet as a sequence, not a memory dump: population, households, age, income, macro, sector, penetration and unit checks. The final takeaway is simple - a credible guesstimate is not the most precise one, but the one that starts from the right base and survives a sanity check.