
Common-Size and Trend Analysis Explained
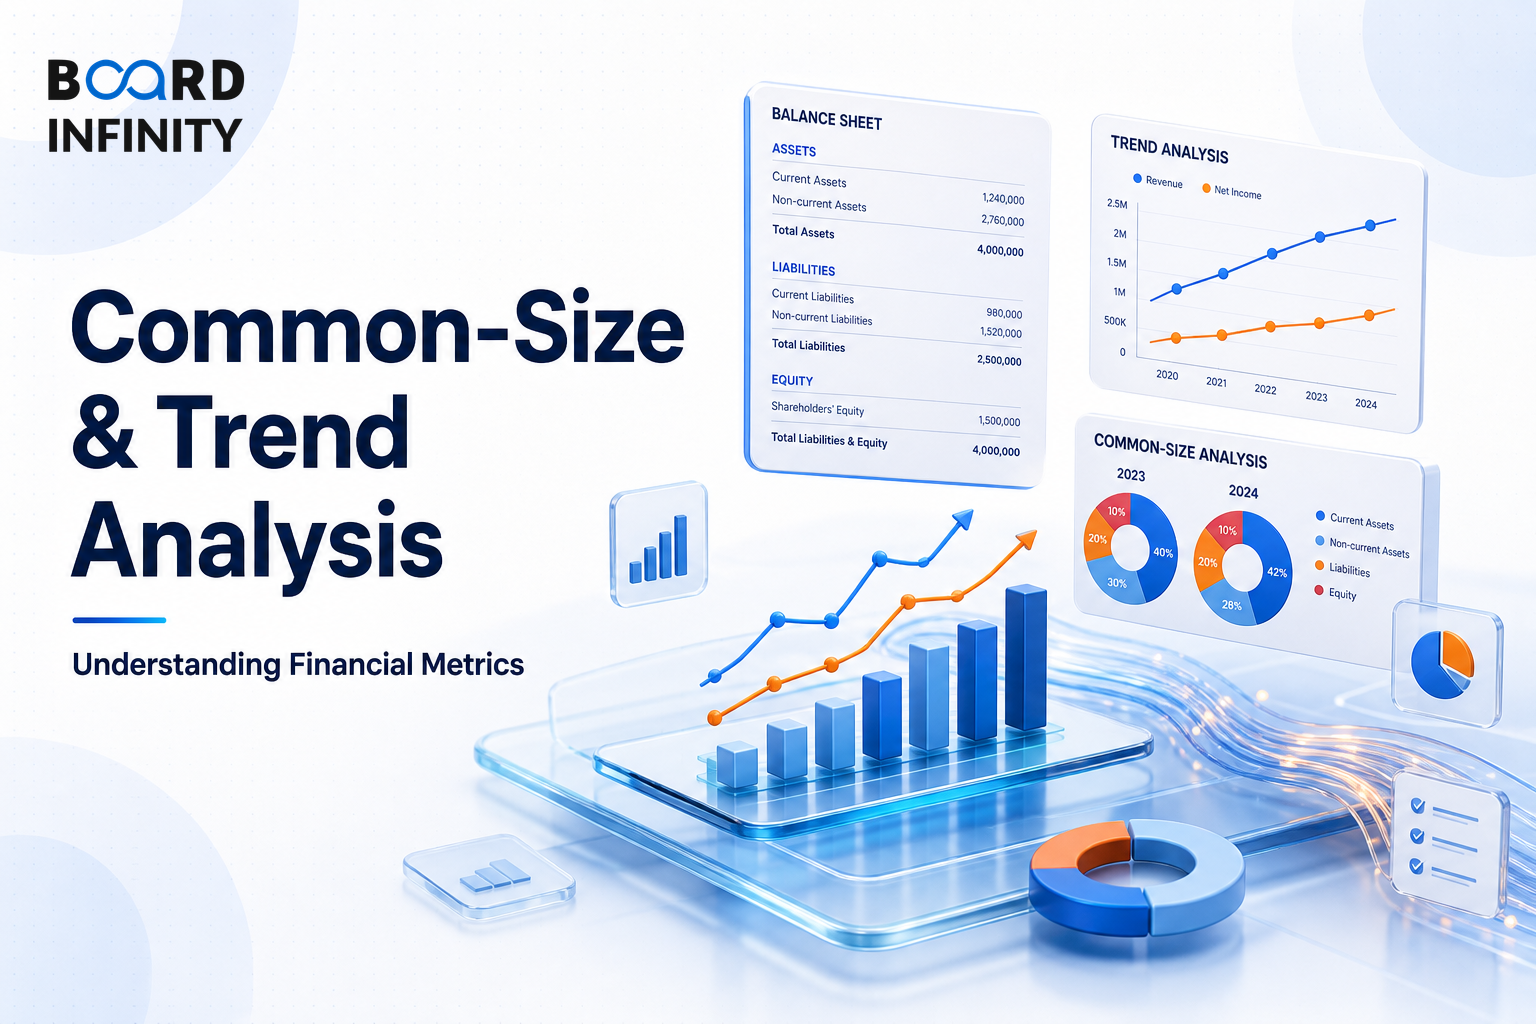
DuPont Analysis breaks Return on Equity (ROE) into its drivers; common-size and trend analysis answer a simpler comparison question: how do financial statement line items look when converted into percentages? These tools matter in interviews because they make Profit & Loss Account (P&L), Balance Sheet, and multi-year statements comparable across companies, years, and balance sheet structures.
- Vertical (Common Size) - P&L expresses each line as % of Revenue to compare margins across companies regardless of size.
- In Profit & Loss Account (P&L), Earnings Before Interest, Tax, Depreciation & Amortization (EBITDA) margin helps compare operating efficiency before capex.
- TCS EBITDA margin 25% vs Infosys 22.5% shows an operational efficiency gap.
- Vertical (Common Size) - Balance Sheet expresses each line as % of Total Assets to compare capital structure & asset composition.
- HDFC Bank: Loans = 60% of assets; RBI norm <75%.
- Horizontal (Trend) Analysis uses year-on-year % change for each line item to identify growth trends and detect anomalies.
- Indexed Trend Analysis sets base year = 100, track subsequent years for multi-year growth visualization across items.
Big Picture: Percentage-Based Comparability
Common-size and trend analysis are percentage-based tools. Vertical analysis compares financial statement structure at a point in time, while horizontal and indexed trend analysis compare how line items move across years.
Common-size and trend analysis convert financial statements into percentages: P&L lines as % of Revenue, Balance Sheet lines as % of Total Assets, year-on-year % changes, or indexed values with base year = 100.
TCS EBITDA margin 25% vs Infosys 22.5% - operational efficiency gap. The comparison works because each line is expressed as % of Revenue, so margins can be compared across companies regardless of size.
Vertical Common Size - P&L
Income Statement, also called P&L - Profit & Loss Account, reports a company's financial performance over a period, quarter or year. In vertical common-size analysis for P&L, each line is expressed as % of Revenue.
The purpose is to compare margins across companies regardless of size. For example, TCS EBITDA margin 25% vs Infosys 22.5% indicates an operational efficiency gap.
Vertical Common Size - Balance Sheet
The Balance Sheet is a snapshot of a company's financial position at a point in time. Assets show what the company owns; liabilities show what it owes; equity shows the net worth.
In vertical common-size analysis for the Balance Sheet, each line is expressed as % of Total Assets. The purpose is to compare capital structure & asset composition, such as HDFC Bank: Loans = 60% of assets; RBI norm <75%.
Horizontal Trend Analysis
Horizontal (Trend) Analysis uses year-on-year % change for each line item. Its purpose is to identify growth trends and detect anomalies.
A sudden 30% jump in debtors with flat revenue = potential revenue inflation. This is why trend analysis is not just about growth; it also flags line items that move differently from the underlying business.
Indexed Trend Analysis
Indexed Trend Analysis sets base year = 100, then tracks subsequent years. It is used for multi-year growth visualization across items.
TCS Revenue indexed 100 (FY20) to 167 (FY24) = 67% growth in 4 years. The indexed view makes the multi-year growth pattern easier to compare across line items.
Structuring a Common Interview Answer
"How would you use common-size and trend analysis to compare TCS, Infosys, or HDFC Bank?"
The fastest way to lose marks is to mix the denominator: P&L uses Revenue, Balance Sheet uses Total Assets, and trend analysis uses year-on-year % change or base year = 100.
Comparing raw rupee line items instead of converting them into percentages is the most frequent error. It misses the point of common-size analysis: compare margins across companies regardless of size, compare capital structure & asset composition, and detect anomalies like a sudden 30% jump in debtors with flat revenue.
Conclusion
Common-size and trend analysis are simple percentage-based tools: express P&L lines as % of Revenue, Balance Sheet lines as % of Total Assets, track year-on-year % change, or index the base year to 100. The final takeaway is to use the right base first, then convert the percentage into a business interpretation such as an operational efficiency gap, asset composition check, growth trend, or potential anomaly.