
Data Quality Testing, Freshness & Pipeline Monitoring
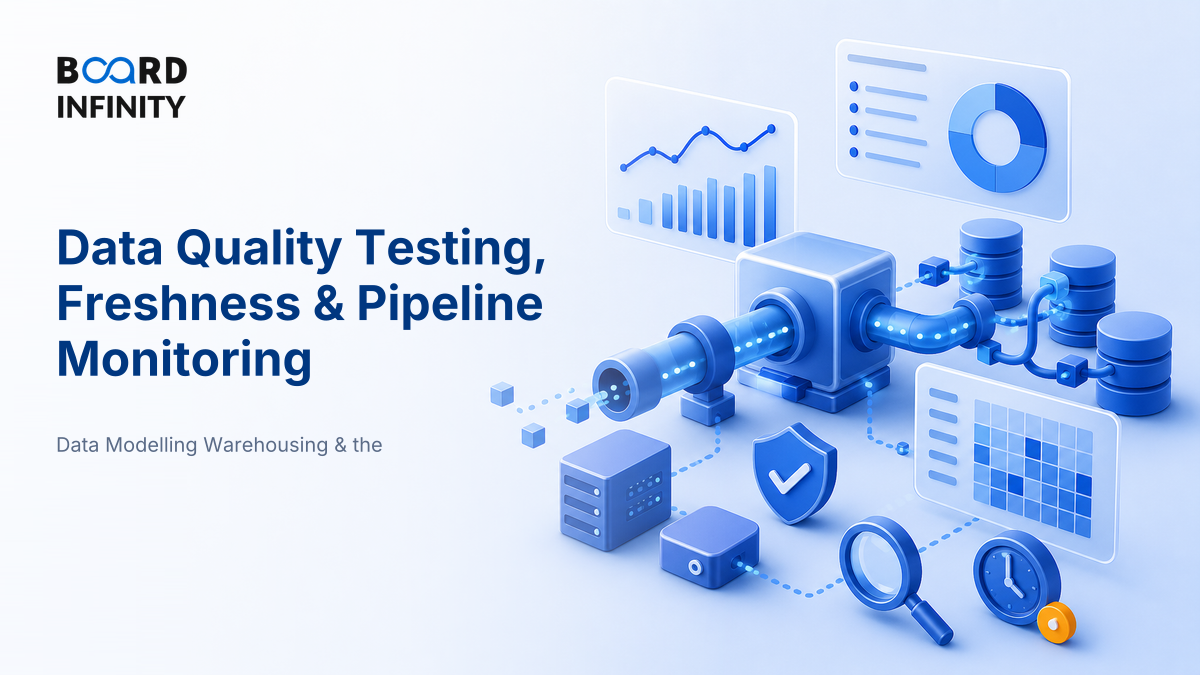
The biggest misconception about data quality is that it means “clean data.” In real businesses, bad data often looks perfectly clean - a dashboard loads, a chart updates, a KPI has decimals - but the orders table stopped refreshing three hours ago and nobody noticed.
- Data quality testing checks whether data is accurate, complete, valid, consistent, unique and fit for use.
- Freshness asks: “Is this dataset updated recently enough for the decision it supports?”
- Pipeline monitoring tracks whether data jobs, dependencies, schemas, volumes and SLAs are behaving normally.
- The strongest mental model is a loop: define expectations - test data - monitor pipelines - alert owners - fix root causes.
- Key metrics include freshness lag, SLA attainment, test pass rate, null rate, duplicate rate and pipeline success rate.
- Good candidates connect data quality to business risk: wrong incentives, failed reconciliation, bad targeting, compliance errors or broken CX.
- The common mistake is testing only the final dashboard, instead of testing the pipeline from source to consumption.
Think of data quality as an operating system, not a one-time cleaning activity. A modern data team does not simply “clean” tables before analysis; it sets expectations, detects drift, catches freshness failures and fixes the upstream reason before business users make decisions on bad numbers.
Core Explanation: What You Are Really Testing
A data pipeline moves data from source systems such as apps, payment gateways, CRMs and databases into warehouses, dashboards, ML models or operational systems. Quality testing asks whether the data is usable; freshness asks whether it is current enough; monitoring asks whether the machinery that produces it is healthy.
The easiest way to explain it is to separate data checks from pipeline checks. Data checks validate the content. Pipeline checks validate the movement.
Freshness: The Measures That Catch Silent Staleness
Freshness is the time gap between when data should be available and when the latest usable record actually arrives. It matters because many analytics failures are not visibly “wrong”; they are simply old.
Freshness must always be tied to a data SLA: the maximum acceptable delay for a dataset, report or model feature. A live fraud feature may need seconds or minutes; a board-level monthly P&L table may be fine after close and reconciliation. “Good” freshness is therefore not universal - it is freshness that meets the decision’s SLA.
Worked Example: Freshness and Quality in One Mini Check
Assume a quick-commerce team has an orders_fact table used for hourly city performance. The SLA says the table must refresh within 60 minutes.
The interview-worthy insight: a table can pass some content checks and still be unusable because it is stale. That is why freshness and pipeline health are monitored alongside classic data quality tests.
Data Quality Test Types You Should Be Able to Name
When an interviewer says “What tests would you add?”, do not answer vaguely with “I will clean the data.” Name the test type, what it catches and the decision risk.
For an Indian payments or lending business, pipeline quality is not just a dashboard issue. Delayed UPI transaction statuses, duplicate callbacks, failed joins between payment and customer systems, or stale risk features can affect reconciliation, user support and credit decisioning. The strategic so what: in regulated, high-volume environments, monitoring protects trust, not just reporting accuracy.
Definitions You Can Say in One Breath
- Data quality: ISO-style quality concept applied to data - the degree to which data characteristics fulfil requirements.
- Data quality testing: Automated checks that verify whether data meets expected rules for business use.
- Freshness: The gap between now and the latest usable data available to consumers.
- Pipeline monitoring: Continuous observation of data jobs, dependencies, volumes, latency, schemas and alerts.
- Data SLA: A service-level promise for when, how complete and how reliable a dataset must be.
Case Study: GitLab and Analytics Quality as an Operating System
GitLab is a useful case because its public data-team practices show data quality as workflow, ownership and automation - not as manual spreadsheet cleaning.

Situation: GitLab operates as a highly transparent, distributed software company with many teams depending on product, sales, marketing and finance data. In such a setup, a broken transformation or stale model can travel quickly into dashboards and planning conversations.
The move: GitLab’s public analytics practices emphasize version-controlled data models, documented ownership, automated tests and issue-based workflows. Instead of relying only on analysts to notice suspicious dashboards, quality rules are embedded into the data development process. Typical controls include tests for uniqueness, non-null fields, accepted values, model dependencies and freshness expectations.
Outcome and lesson: The most important lesson is not “GitLab uses a tool.” The primary driver is treating analytics data as a maintained product with owners and checks. Supporting drivers include version control, documentation, peer review, automated testing and transparent issue resolution. That combination makes failures easier to catch, assign and fix.
For an MBA answer, the “so what” is powerful: data quality is a management system. Tools matter, but ownership, SLAs, escalation paths and root-cause fixes decide whether the organization actually trusts its data.
How AI Changes Data Quality Testing, Freshness & Pipeline Monitoring
AI is making data observability more proactive, but it does not remove the need for clear business rules. In 2026, the best teams use AI to find patterns faster while humans still define what “acceptable” means.
Use ChatGPT or Claude with a company scenario: “Here is a food-delivery data pipeline from app events to warehouse to dashboard. Generate 10 data quality tests, 5 freshness SLAs and 5 monitoring alerts, then rank them by business impact.” This turns a vague analytics answer into an interview-ready monitoring plan.
Interview Relevance
“You are the product analyst for a delivery business. The city-level order dashboard suddenly looks flat since morning. How would you check whether this is a real business issue or a data pipeline issue?”
Use the phrase “data product reliability”. It signals that you understand data quality as a business operating capability, not just a technical cleaning task.
Common Mistake
The biggest mistake is saying, “I will check the dashboard numbers,” and stopping there. That loses marks because dashboards are only the final symptom - the defect may be in events, ingestion, joins, schema, freshness or ownership. One-line fix: trace the pipeline from source to consumption and test both data content and pipeline health.
What to Revise Next
Next, move one step upstream and one step downstream. First revise Event Tracking & Instrumentation: Clean Data at Source, because many quality issues begin when events are badly defined. Then revise Case Study: Designing a Warehouse Model for a Delivery Business, because monitoring becomes much easier when the warehouse model itself is well-designed.