
Star Schema versus Snowflake Schema: Choosing a Design
Many students think snowflake schema is “better” because it is more normalized. In analytics, that instinct can hurt you: the cleanest database design is not always the fastest design for a business user clicking a dashboard at 9:30 a.m.
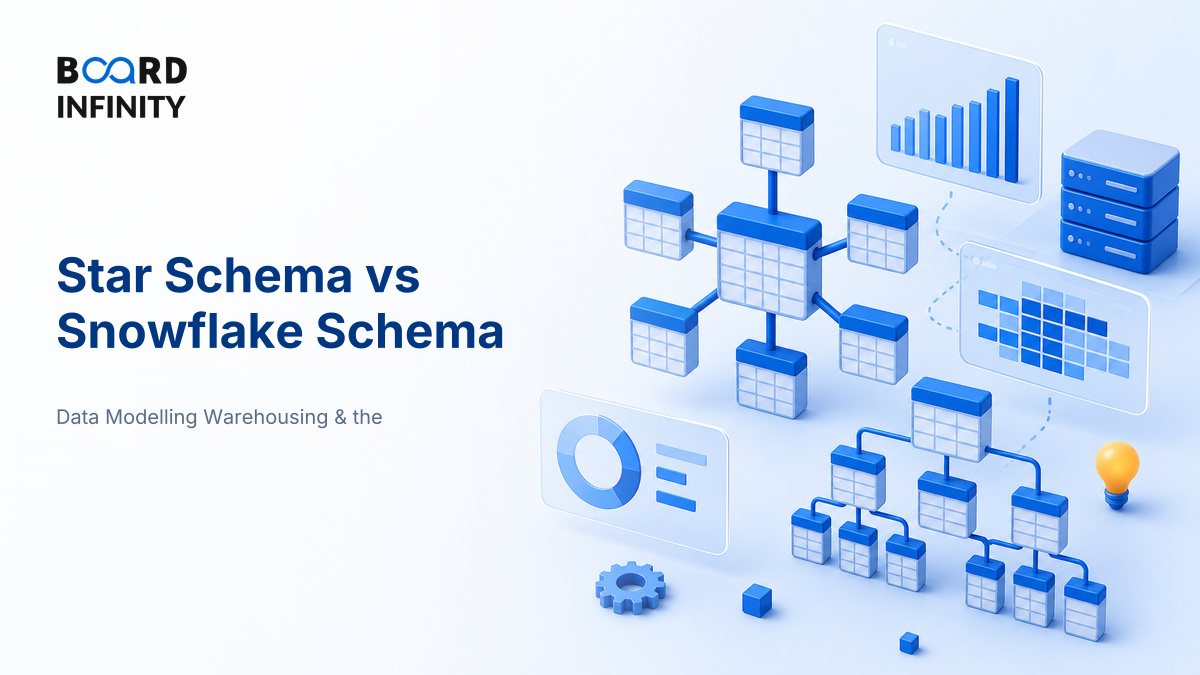
- Star schema keeps one central fact table connected directly to denormalized dimension tables - simple, fast, and BI-friendly.
- Snowflake schema normalizes dimensions into sub-dimensions - cleaner storage and hierarchy control, but more joins.
- Always start with the grain: one row means one order line, one payment, one ride, one inventory snapshot, etc.
- Choose star when dashboard speed, self-service analytics, and simple joins matter most.
- Choose snowflake selectively when dimensions are large, hierarchical, reused, or governed centrally.
- The best real design is often a hybrid: star marts for reporting, snowflaked reference dimensions where complexity demands it.
- Interview trap: do not say “snowflake is normalized, so it is always better.” Analytics design optimizes decision speed, not theoretical purity.
Think of the choice as a trade-off between human-friendly analytics and storage or governance discipline. Star schema pulls descriptive context closer to the fact table; snowflake schema pushes repeated attributes into separate lookup tables.
Core Explanation: The Design Choice Starts with Grain
The fact table is the measurement table: sales amount, quantity, discount, delivery time, payment value, clicks, refunds. The dimension tables describe the fact: customer, product, date, store, city, channel, campaign, device.
The most important question is not “star or snowflake?” It is: what does one row in the fact table represent? That row-level meaning is called the grain. If the grain is wrong, both schemas fail.
Example: In an e-commerce sales mart, the grain might be one row per order item. That means a single order with three products creates three fact rows. Measures like item revenue and discount sit in the fact table; product name, brand, category, customer city, and order date sit in dimensions.
Star Schema: Why Analysts Love It
In a star schema, each dimension connects directly to the fact table. Dimension tables are usually denormalized, meaning related descriptive attributes are stored together even if some values repeat.
For example, a product dimension may contain product ID, product name, brand, category, sub-category, and size in one table. This repeats category values across many products, but it makes reporting simple.
A grocery chain in India tracking daily store sales would usually prefer a star schema for its sales dashboard: fact_sales joins directly to date, store, product, and promotion dimensions. The primary driver is fast, simple reporting for category managers; supporting drivers are fewer joins, easier SQL, and lower training effort for business users. The strategic so what: analytics adoption often improves when the model matches how managers ask questions.
Snowflake Schema: Why Data Engineers Use It Selectively
In a snowflake schema, one or more dimensions are normalized into additional linked tables. Instead of keeping product, brand, category, and department in one wide product dimension, you may split them into product_dim, brand_dim, category_dim, and department_dim.
This is useful when dimension hierarchies are large, shared, or tightly governed. A bank, for example, may not want every analytics mart to maintain its own geography hierarchy; city, state, region, and branch hierarchy may be centrally managed.
The trade-off is extra joins. That can slow queries, make SQL harder for analysts, and increase the chance of join mistakes.
The Practical Decision Loop
Do not choose the schema from habit. Use a loop: define the business question, fix the grain, test the joins, check performance, then evolve the model. Mature analytics teams revisit design because business hierarchies change - new channels, new cities, new customer segments, new products.
When to Choose Star vs Snowflake
Definitions You Can Say in One Breath
- Fact table: A table storing measurable business events at a declared grain.
- Dimension table: A table storing descriptive attributes used to filter, group, and explain facts.
- Star schema: A dimensional model with one central fact table directly linked to denormalized dimensions.
- Snowflake schema: A dimensional model where dimensions are normalized into related sub-dimension tables.
- Grain: The exact business meaning of one row in a fact table.
- Denormalization: Combining related attributes into fewer tables to simplify reads and reduce joins.
Ralph Kimball popularized dimensional modeling for analytics because it makes business measurement easier to understand and query. That is the spirit behind star schema: model the data the way business users ask questions.
Metrics to Evaluate a Schema Design
A strong answer does not stop at “star is faster.” It explains how you would test the design. Use these measures when comparing alternatives.
Case Study: Urban Company Service Analytics Mart
Urban Company is a useful Indian marketplace example for understanding how a service-order analytics mart can use a star-first design with selective snowflaking.
Urban Company operates a marketplace where customers book services such as beauty, home cleaning, appliance repair, and other home services across Indian cities and beyond. The business questions are operational and commercial: Which service categories are growing? Which city has better fulfillment? Which provider cohorts have repeat bookings? Which channels bring profitable customers?
This is a design case based on Urban Company’s publicly observable business model, not a claim about its internal warehouse. For an analytics mart serving managers, the primary design driver would be fast service-order reporting. Supporting drivers would include consistent city and category definitions, easy slicing by provider and customer, and reliable history as service categories evolve.

The lesson: a pure snowflake design may look elegant, but managers need quick answers to booking and service-quality questions. A star-first mart gives speed and usability; selective snowflaking protects governed hierarchies such as service taxonomy and geography. The win comes primarily from matching the model to decision workflows, supported by clear grain, governed dimensions, and performance testing.
How AI Changes Star Schema versus Snowflake Schema
AI does not remove the need for schema design. It raises the cost of bad design because more users now ask natural-language questions that generate SQL automatically.
- Natural-language BI needs semantic clarity: Tools that translate “show repeat bookings by city” into SQL work better when fact grain, dimension names, and relationships are unambiguous. Star schemas often help because joins are simpler.
- AI-assisted modeling speeds first drafts: LLMs can propose fact tables, dimensions, and grain from sample source tables, but they may hallucinate relationships. Human validation of grain and keys remains non-negotiable.
- AI governance increases metadata value: Data catalogs, lineage tools, and semantic layers can use AI to flag inconsistent dimensions, duplicate metrics, and risky joins across marts.
Take a company you are preparing for, describe its business model, and ask ChatGPT: “Design a star schema for its key revenue dashboard. State the fact grain, dimensions, measures, and where snowflaking may be justified.” Then challenge the answer by asking: “Which joins are risky and which dimension changes need history?”
Interview Relevance
“You are designing a sales analytics warehouse for an e-commerce company. Would you choose a star schema or a snowflake schema? Defend your choice.”
Use the phrase: “I would start with a star schema for the reporting mart, then snowflake only the dimensions where governance or hierarchy complexity justifies the extra joins.” That sounds practical, not textbook.
Common Mistake
The costly mistake is saying “snowflake is better because normalization is always better.” It ignores the purpose of analytics systems: fast, trusted decision-making. The one-line fix: start with grain and query patterns, choose star for usability, and snowflake only where complexity or governance earns it.
What to Revise Next
Once schema choice is clear, revise how warehouses preserve changing business reality and how data reaches the warehouse in the first place.