
The Indian Bond Market Explained: Instruments, RBI Policy and Yield Curves
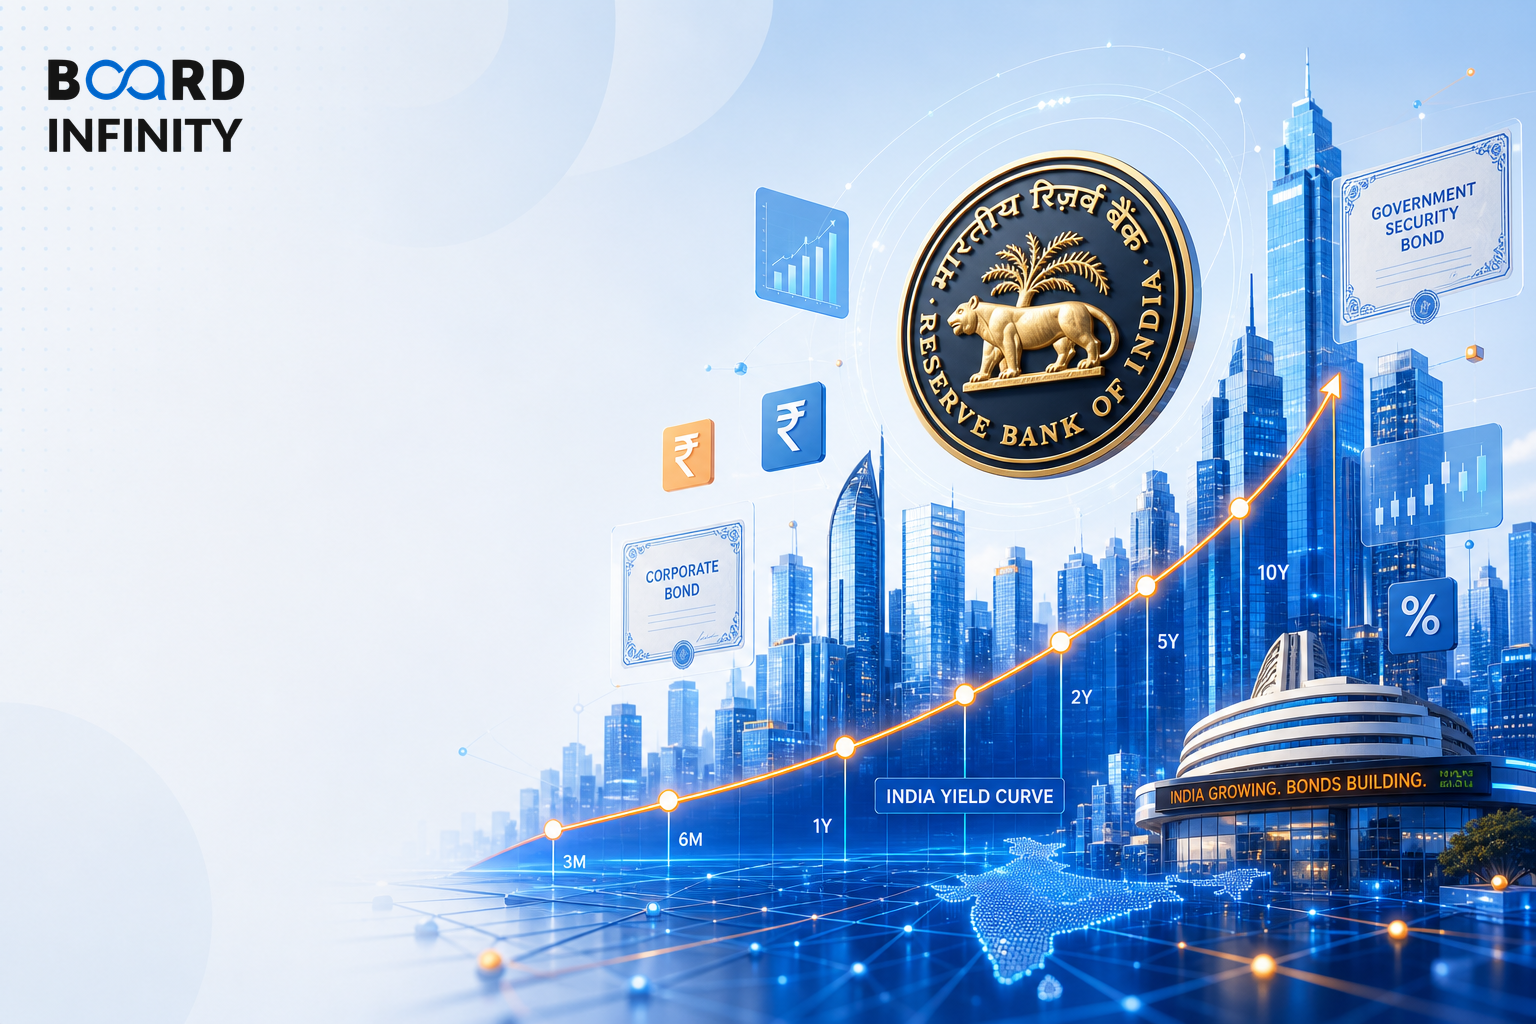
After understanding Credit Analysis & Credit Rating Scales, the next question is how those rated debt instruments fit into India's fixed income market. The Indian bond market matters in interviews because candidates are often expected to connect instruments, RBI policy levers, and yield curve movements into one coherent market view.
- Government Securities (G-Secs) are issued by RBI on behalf of GoI. Benchmark 10Y G-Sec yield is approximately 7.0-7.3% (2024), and total outstanding G-Secs are approximately ₹100+ lakh crore.
- State Development Loans (SDLs) are issued by state governments and typically trade 25-50 bps above G-Secs.
- The corporate bond market is ₹45+ lakh crore outstanding and is dominated by AAA/AA issuers such as PSU bonds, NBFCs, and banks.
- Money market instruments include T-Bills (91D/182D/364D), CPs (Commercial Paper - 7 days to 1 year), and CDs (Certificate of Deposit - banks, 7 days to 1 year).
- RBI monetary policy instruments include repo rate, reverse repo / SDF, CRR, SLR, OMO, and LAF.
- An inverted yield curve means short-term yields are greater than long-term yields and is a classic recession predictor.
- India's yield curve (2024) is relatively flat at the short end (7.0-7.3%) due to RBI's tight monetary stance to anchor inflation.
Big Picture: Instruments, Policy Levers, and Yield Curve Signals
India's bond market can be read through four instrument groups: Government Securities (G-Secs), State Development Loans (SDLs), corporate bonds, and money market instruments. The interview-relevant interpretation then connects those instruments to RBI monetary policy instruments and yield curve signals such as normal, inverted, and flat curves.
Normal yield curve: Long-term yields > Short-term yields. Inverted yield curve: Short-term yields > Long-term yields.
Government Securities, SDLs, Corporate Bonds, and Money Market Instruments
Government Securities (G-Secs) are issued by RBI on behalf of GoI. The benchmark 10Y G-Sec yield is approximately 7.0-7.3% (2024), and total outstanding G-Secs are approximately ₹100+ lakh crore.
State Development Loans (SDLs) are issued by state governments. They typically trade 25-50 basis points (bps) above G-Secs.
Corporate Bond Market has ₹45+ lakh crore outstanding. It is dominated by AAA/AA issuers, including PSU bonds, NBFCs, and banks.
Money Market Instruments include T-Bills (91D/182D/364D), CPs (Commercial Paper - 7 days to 1 year), and CDs (Certificate of Deposit - banks, 7 days to 1 year).
RBI Monetary Policy Instruments
RBI monetary policy instruments matter because they affect liquidity, short-term rates, G-Sec prices, and the transmission of policy into borrowing costs. In interviews, the key is to explain not only what each instrument is, but also how it impacts markets.
What an Inverted Yield Curve Signals
Normal yield curve: Long-term yields > Short-term yields. It reflects expectations of future growth and inflation, plus term premium for holding longer-dated bonds.
Inverted yield curve: Short-term yields > Long-term yields. It is a classic recession predictor.
The mechanism is: central bank hikes short-term rates aggressively to fight inflation; bond market expects a future recession + rate cuts; long-term yields fall as investors expect lower future rates.
Worked Example: 10Y-2Y US Treasury Spread
10Y-2Y US Treasury spread inverted in 2022-2023. It preceded regional bank stress and slowdown concerns.
The learning for interviews is that an inverted yield curve should not be described only as a chart shape. It should be explained through the mechanism: aggressive short-term rate hikes, expectations of future recession and rate cuts, and falling long-term yields as investors expect lower future rates.
India Context: Flat Short End and Duration Fund Relevance
India's yield curve (2024) is relatively flat at the short end (7.0-7.3%) due to RBI's tight monetary stance to anchor inflation.
As RBI begins rate cut cycle (FY25), expect: short-term rates fall first, curve steepens, bond prices rally, especially long-duration G-Secs. This is why FY25 is considered favourable for duration fund investors in India.
Flat Curve Interpretation
A flat curve signals economic uncertainty. Banks' Net Interest Margins (NIMs) compress because banks borrow short and lend long. If both rates are similar, spread disappears.
Flat curve = bad for bank profitability, neutral for borrowers.
Structuring a The Indian Bond Market Explained Interview Answer
"What does an inverted yield curve signal?"
Do not stop at saying an inverted yield curve is a recession predictor. The stronger answer explains the mechanism and then adapts it to India's relatively flat short end, RBI's tight monetary stance, and the expected steepening as the rate cut cycle begins.
The most frequent error is treating every flat or inverted curve as the same signal. In interviews, that costs points because the US 10Y-2Y inversion in 2022-2023 is linked to recession and slowdown concerns, while India's 2024 short-end flatness is linked to RBI's tight monetary stance to anchor inflation.
Conclusion
The Indian bond market is best understood by linking its major instruments, RBI monetary policy instruments, and yield curve interpretation. For interviews, the final takeaway is simple: explain the market facts, show how policy affects rates and liquidity, and interpret curve movements through their impact on bond prices, duration funds, banks, and borrowers.