
Service Levels, Queueing & Customer Waiting Experience
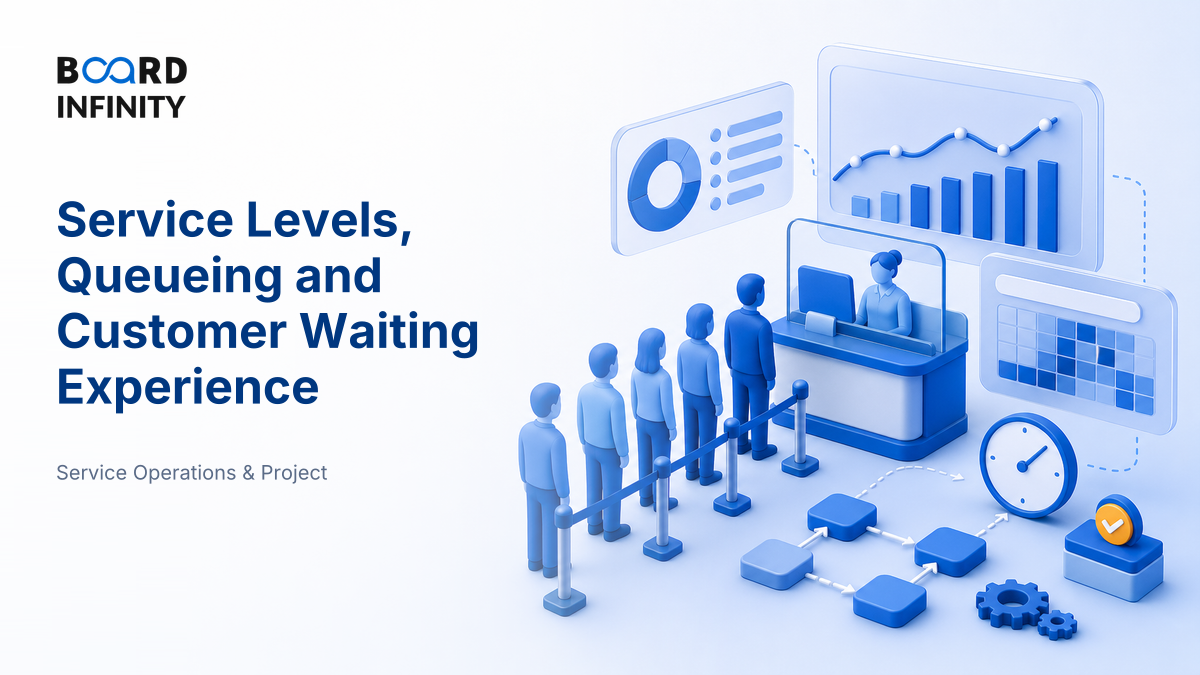
Two service counters can have the same staff, the same customers and the same opening hours - yet one feels calm while the other feels broken. The difference is rarely “hard work”; it is how demand, capacity, variability and the visible waiting experience are designed.
- Service level is the percentage of customer requests served within a promised time target.
- Queueing happens when arrivals temporarily exceed available service capacity.
- The core equation is Little's Law: L = λW - customers in system = arrival rate × time in system.
- High utilization sounds efficient, but as utilization nears 100%, waiting time rises sharply.
- Customer waiting experience is not only actual wait - it is also perceived fairness, information, comfort and control.
- Best answers separate capacity levers from experience levers: add staff, reduce variability, segment queues, show wait time, enable self-service.
- The interview trap: promising a service level without mentioning cost, variability or the operating model needed to deliver it.
Big Picture: A Queue Is Both a Math Problem and a Feeling
A queue is not just people standing in line. It is a small operating system: demand arrives, limited capacity serves it, variation creates waiting, and the customer judges the wait emotionally.
If you only optimise staffing, customers may still feel ignored. If you only improve ambience, the line may still explode at peak demand. The best service systems manage both sides.
Core Explanation: What Actually Creates Waiting?
Waiting is created by a mismatch between arrival rate, service rate and variability.
- Arrival rate (λ) - how many customers arrive per unit of time.
- Service rate (μ) - how many customers one server can complete per unit of time.
- Utilization (ρ) - the proportion of capacity being used. For one server, ρ = λ / μ.
- Queue discipline - the rule for who gets served next: first-come-first-served, priority, appointment, triage or reservation.
- Service level target - the promised threshold, such as “90% of customers served within 10 minutes.”
The hidden villain is variability. If ten customers arrive evenly every hour, one counter may cope. If all ten arrive in the same five minutes, the same counter creates a visible queue. That is why service design uses appointments, tokens, priority rules, express lanes and self-service to smooth demand.
The Service Level Trade-Off: Faster Is Better, but Not Free
A service level is a promise, and every promise needs capacity behind it. Moving from “most customers served within 30 minutes” to “almost everyone served within 5 minutes” usually requires extra staff, better scheduling, automation or lower variability.
This is where many candidates sound naïve. They say “increase service level” as if it is free. A stronger answer says: choose the service level by segment, estimate the demand pattern, design capacity, and measure the customer experience.
Definitions You Should Be Able to Say Cleanly
- Service level: Percentage of customer requests completed within a defined time or availability promise.
- Queueing: The study of waiting lines when demand for service temporarily exceeds available capacity.
- Little's Law: Average customers in system equals arrival rate multiplied by average time in system, or L = λW, introduced by John D. C. Little in 1961 (Operations Research).
- Utilization: The fraction of service capacity actively used over a chosen time period.
- Perceived wait: The customer's felt waiting time, shaped by uncertainty, fairness, comfort and progress cues.
Metrics to Track: The Six Numbers That Make Waiting Visible
Use metrics to separate three questions: are we meeting the promise, are customers suffering, and is capacity being used efficiently?
Notice the balance: utilization protects cost, while P95 wait and abandonment protect customer experience. A service can have a decent average wait and still fail customers if the tail is terrible.
Worked Example: A Simple Queue Calculation
Suppose a helpdesk gets 12 customers per hour. One trained agent can serve 15 customers per hour.
- Arrival rate λ = 12 per hour
- Service rate μ = 15 per hour
- Utilization ρ = λ / μ = 12 / 15 = 80%
For a simple single-server M/M/1 queue, average time in system is:
W = 1 / (μ - λ) = 1 / (15 - 12) = 1/3 hour = 20 minutes
Average number of customers in the system using Little's Law:
L = λW = 12 × 1/3 = 4 customers
Now see the sensitivity. If arrivals rise from 12 to 14 per hour, utilization becomes 14/15 = 93.3%, and W becomes 1/(15-14) = 1 hour. A small demand increase creates a massive waiting increase because capacity is nearly full.
In queues, the danger zone starts before 100% utilization. Once utilization gets too high, variability has no cushion, so waiting time rises non-linearly.
How to Improve Waiting: Four Levers That Actually Work
Good service design does not jump straight to “hire more people.” It checks four levers: demand, capacity, queue discipline and experience design.
For process-heavy services, queue performance often depends on how work is divided across stations. If one step is always slower than the rest, study Line Balancing and Workstation Design next because it explains how bottlenecks form inside a service flow.
Mini Case Study: Passport Seva and the Shift from Crowds to Appointments
India's Passport Seva system shows how appointment booking, token flow and front-end digitisation can turn a stressful public-service queue into a managed service experience.

Passport applications are naturally queue-prone: demand is high, documents vary, verification steps are strict, and customers are anxious because errors can delay travel plans. The older experience many citizens associated with public services was uncertainty - when to arrive, where to stand, which document was missing and how long the process would take.
The redesigned service model moved key steps online: applicants can fill forms, pay fees and book appointments through the Passport Seva portal. At Passport Seva Kendras, the operating logic is closer to a managed service flow: appointment slots control arrivals, token systems guide movement, counters separate activities, and document checks reduce rework.
The lesson is not “technology solved queues.” The stronger explanation is: appointment-led demand control was the primary driver, supported by online pre-processing, standardized document flow, token-based routing and clearer customer communication. That is a complete operations answer.
How AI Changes Service Levels, Queueing and Customer Waiting Experience
AI is not replacing queueing logic; it is making the demand and experience side more dynamic.
- Predictive staffing: ML models can forecast arrivals by hour, branch, weather, campaign, salary day or festival pattern, helping managers staff before queues form.
- Intelligent routing: AI can classify requests by urgency, complexity and customer value, then route simple issues to bots and complex issues to specialists.
- Real-time experience sensing: Speech analytics, chat sentiment and abandonment signals can flag when customers are frustrated before the SLA formally fails.
But AI does not remove the need for operating discipline. If the underlying process is broken, AI may simply predict the failure earlier.
Before a service-operations interview, load a company's annual report, app reviews and support FAQs into NotebookLM. Ask: “What are the likely customer waiting points, what service-level metrics should be tracked, and what queueing levers could improve them?” Then convert the answer into a 5-step operating plan.
AI also links naturally to staffing and replenishment decisions. If you want the operations analytics angle, revise Using AI for Inventory Optimisation and Replenishment because the same forecasting logic appears in service capacity planning.
Interview Relevance
“A bank branch has long queues between 11 a.m. and 2 p.m. Customers are complaining, but the branch manager says staff utilization is excellent. How would you diagnose and improve the situation?”
Use the phrase: “I would not optimise utilization alone; I would optimise the service level at an acceptable cost.” That line signals maturity.
If the interviewer frames this as an outsourced call-centre or vendor SLA problem, connect service promises to incentives. A useful next step is Contracting, Incentives and Service Agreements, where response-time metrics become commercial commitments.
Common Mistake
The mistake: treating waiting only as a capacity shortage. Candidates immediately say “add more counters” and miss demand smoothing, segmentation, variability reduction and perceived-wait design. Fix: diagnose arrivals, service rate, variability, queue discipline and customer perception before recommending capacity.