Types of Data in Statistics
Introduction
Data plays a significant role in the field of data science. Raw data is put into enormous experiments to generate meaningful insights that drive many business goals. Understanding different data types in statistics will take you one step closer to picking the data type that matches your business requirements. The data type knowledge will help you accurately apply statistical measurement to raw data and conclude meaningful insights. You must be able to identify the data type you are working with if you want to select the apt visualization method.
This article lists the different data types in statistics that you must know for performing proper exploratory data analysis. It plays a crucial role in the pipeline of a machine learning project.
Types of Data in Statistics
The data in statistics have the following types:
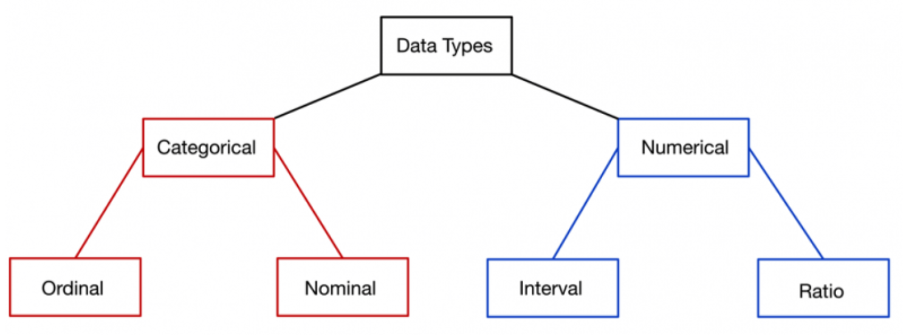
Categorical Data (Qualitative Data)
Categorical data represents characteristics. It is also called qualitative data, which means you cannot express it as a numerical value. Therefore, you cannot measure it. It involves variables such as words, symbols, pictures, which help you sort information based on a category—for example, holiday destinations, gender, language, etc.
The categorical data has the following two categories of data:
1. Nominal Data
Nominal type of data involves variables that do not have any natural order. It is also known as nominal scale and derives its origin from a Latin word nomalis, which means pertaining to name. It helps you in labeling variables without providing the numerical value. You cannot order or measure nominal data sets. Furthermore, you cannot perform any arithmetic operation on nominal variables like addition, subtraction, division, multiplication, etc.
Example:
- Color of a person's hair, like blonde, brown, black, burgundy, etc., cannot be compared with one another to derive any meaningful information about it. You cannot conclude that blonde is greater or less than brown.
- Gender is another variable. It is impossible to order the gender category in a rank-wise manner, from highest to lowest.
- Marital status is also another nominal variable. It is not possible to rank the marital status of a person as better than another's.
You can examine the nominal data using the grouping method. You can group similar data into one category and then calculate the percentage or frequency of the respective data. A nominal data type is represented using pie charts.
2. Ordinal Data
Ordinal means something that is in order. The ordinal type of data involves variables that follow a natural order. Ordinal variables are placed in order by their position (for example, first, second, third, etc.). As the ordinal data variables only represent a sequence, you cannot perform any arithmetic operation on these variables like addition, subtraction, division, multiplications, etc. It is primarily found in surveys, questionnaires, finance, etc.
For example,
- Class ranking in a school: 8th, 9th, 10th, and so on
- Time of the day: morning, afternoon, dawn, evening, night, and so on
- Ranking of athletes in a race: first, second, third
- Rating of a product: five, four, or three stars
You can examine the ordinal data using numerous visualization tools and express the information using tables in which each row shows a unique category.
Numerical Data (Quantitative Data)
It is one of the simplest data types to understand. As the name says, it represents a numerical value and helps answer questions like how many, how much, how long, etc. For example,
- The number of apples
- The number of students in a class
- The height/weight of a person
It attempts to quantify items by measuring numerical variables that make them count in nature. The key here is that a numerical variable can take an infinite number of values.
For example, the height of a person can vary from x cm to y cm and can be further broken down based on the fractional values.
Based on the data sets, the quantitative data is further classified into the two following categories of data:
1. Discrete Data
Discrete type of data involves only integers or discrete values. It contains a finite number of values that cannot be subdivided into smaller parts. It takes into account only those items that you cannot measure but only count.
For example,
- Number of boats on a port
- Number of employees in an organization
You can use a bar chart to display discrete types of data.
2. Continuous Data
On the other hand, a continuous type of data is the data that you can measure. It contains an infinite number of values that can be subdivided into smaller parts. It takes into account only those items that you cannot count but only measure. It can take any value between two numbers like 45.7, 23.8, 10.4, and so on.
For example,
- Length of pages of a book
- Time taken by athletes to finish a race
- The weight of students in a class
The two questions you need to ask yourself to identify whether the given data is discrete or continuous:
1) Can you count it? If yes, discrete.
2) Can you reduce any value in half and it still makes sense? If yes, continuous.
It is further divided into the following categories of data:
3. Interval Data
Interval data values have meaningful distances between the measurements defined. It is a data type that is measured along a scale, in which each point is placed at an equal distance from one another. It involves variables containing numerical values that you can order and calculate the exact difference between them. For example, temperature, dates, time interval (4 am, 4 pm), etc.
The key here is that these values are measurable but have no true zero, which means there are no such things as no temperature or no dates. Interval data allows you to only perform addition or subtraction operations. You cannot multiply or divide the values.
4. Ratio Data
Ratio data is identical to interval data, except it does have an absolute zero. It is also an ordered data unit that can only be measured and ordered with equidistant items. Unlike interval data, these values can never be negative. For example, age, height, or weight of a person. Age, height, or weight can be measured but can never be a negative value.
For analyzing the dispersion or variability in data, tools like a Standard Deviation Calculator can be extremely useful. They help you understand the spread of data points around the mean, which is crucial for many statistical applications.
Conclusion
In this article, you have seen the different types of data used in statistics and how it is categorized into different categories. You also acquired an understanding of the differences between discrete and continuous data types.
If you want to learn more about data science and make a successful career in the fast-growing field, join our Data Science Course to become a Certified Data Scientist! Get access to 150+ hours of premium content and master highly in-demand technologies like SQL, Python, etc. alongside the concepts of Data Exploration, Regression Models, Hypothesis Testing. Get Personalized 1:1 mentoring from top Data Science industry experts and be job-ready.