
Indian Sector Benchmarks for Analytics Metrics
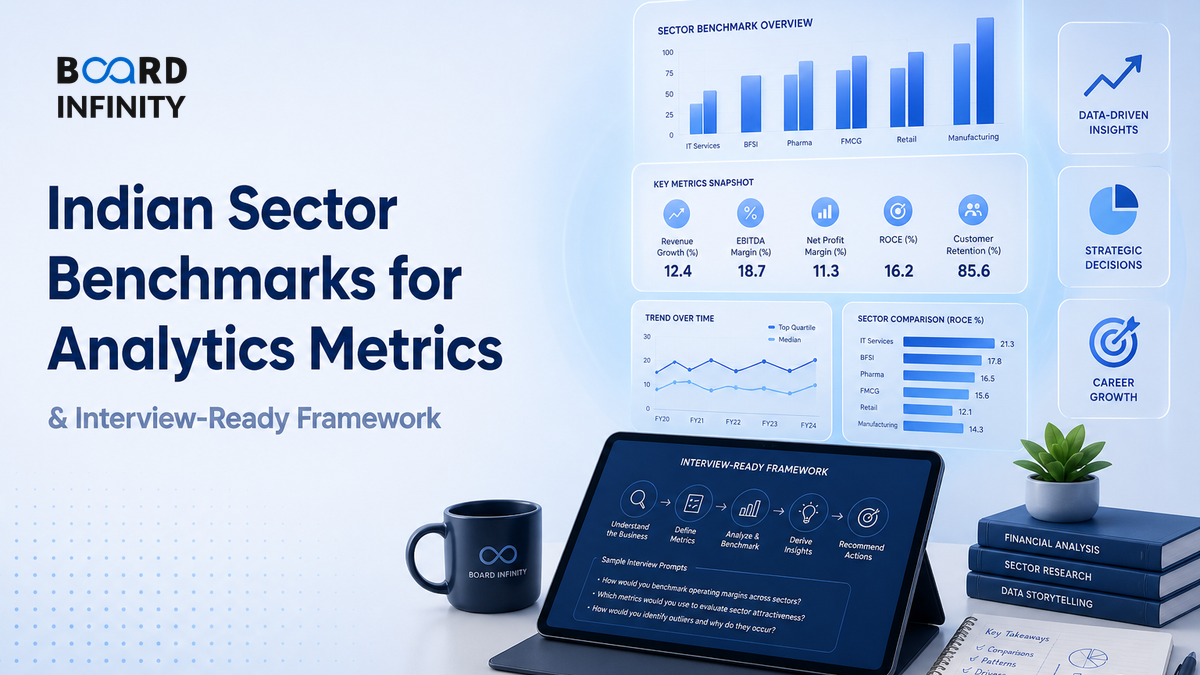
A 2% conversion rate can look weak in a food delivery app, respectable in D2C fashion, and excellent in high-ticket B2B software. That is the trap: analytics metrics do not have one universal “good number” - they only make sense inside a sector, customer journey and business model.
- A benchmark is a comparison point - sector average, best-in-class, historical trend or competitor proxy - used to interpret a metric.
- Never judge a metric alone. A high conversion rate with high returns, fraud or discounting may destroy value.
- Indian benchmarks differ because of UPI adoption, COD behaviour, Tier-2 demand, RBI/SEBI rules, DPDP compliance and price-sensitive acquisition.
- Use metric families: acquisition, activation, engagement, monetisation, retention, risk and operations.
- Good benchmark answers compare three layers: company trend, Indian sector range and unit economics impact.
- For interviews, say the formula first, then the context, then the diagnosis. This sounds analytical, not memorised.
Big Picture: Benchmarks Are a Loop, Not a Lookup Table
The best candidates do not memorise random “industry averages.” They use benchmarks as a diagnostic loop: define the metric, segment it correctly, compare it with a relevant sector range, find the driver, then reset the target.
Core Explanation: What Indian Sector Benchmarks Actually Mean
Indian sector benchmarks for analytics metrics are practical reference ranges used to judge whether a company’s performance is weak, normal or strong for its business context. They are not universal truths. They are starting points for questions.
For example, a quick-commerce company may tolerate lower order margin while it builds density, but it cannot tolerate poor fill rate because stock-outs break the promise of instant availability. A lender may show strong customer acquisition, but if 30-plus-days-past-due delinquency rises, the acquisition quality is poor.
Sector Logic: Why the Same Metric Means Different Things
Use these interview-safe benchmark ranges as directional reference points, not as investment research. Always validate with the company’s latest annual report, investor presentation, app analytics, RBI/SEBI disclosures where relevant, and internal data if you are solving a case.
The key is not to recite a number. The key is to connect the number to the business model. Indian metrics are shaped by payment behaviour, logistics infrastructure, regulation and category maturity.
The Practical Benchmarking Framework
Use this five-step structure when you are given any analytics metric in a case, dashboard review or interview discussion.
Common Indian Sector Benchmark Families
These are the families you should revise because interviewers often move from “what is the metric?” to “what would you track for this sector?”
Worked Example: Reading a D2C Conversion Metric
Suppose an Indian D2C skincare brand gets 500,000 monthly website sessions and 12,500 orders.
Step 1 - Calculate conversion rate: 12,500 orders divided by 500,000 sessions = 2.5%.
Step 2 - Compare: If the broad D2C reference range is 1% to 3%, 2.5% is not weak. It is near the strong end for many categories.
Step 3 - Check counter-metrics: If the return rate is rising, discounts are high and repeat purchase is low, the 2.5% may be promotion-led, not loyalty-led.
Step 4 - Action: Segment conversion by paid search, influencer traffic, organic search, city tier and first-time versus repeat users. Improve the weak segment instead of celebrating the blended average.
Say: “I would not call 2.5% good or bad immediately. I would compare it to the category, then check AOV, returns, CAC and repeat purchase before judging quality.”
Definitions
- Metric: A quantified measure that tracks one aspect of performance or behaviour.
- KPI: A metric tied directly to a business objective and used for decision-making.
- Benchmark: A reference point used to compare performance against history, peers, targets or sector norms.
- Cohort: A group of users sharing a common start event, time period or behaviour.
- North Star Metric: The single metric that best captures delivered customer value and sustainable business growth.
Lenskart: Using Sector Benchmarks in an Omnichannel Business
Lenskart shows why Indian benchmarks must combine digital funnel metrics with store, prescription and fulfilment metrics in one operating system.
Situation: Eyewear is not a pure online impulse purchase. A customer may discover frames on an app, use virtual try-on, book an eye test, visit a store, compare price and then complete the purchase offline or online. A simple website conversion benchmark would understate the real funnel.
The move: Lenskart built an omnichannel model where app discovery, assisted retail, eye testing, prescription accuracy, frame availability and fulfilment are connected. The primary driver was category-specific metric design: instead of only tracking traffic-to-order conversion, the business needed to track eye-test booking, store visit conversion, prescription completion, frame availability and repeat replacement cycles. Supporting drivers included private-label economics, store expansion, technology-led try-on and standardised service processes.
Outcome or lesson: The lesson is not “omnichannel wins.” The lesson is sharper: in high-assistance categories, the benchmark must follow the customer journey across channels. A low app conversion rate may still be healthy if it drives profitable store conversion and repeat eyewear purchases.

How AI Changes Indian Sector Benchmarks for Analytics Metrics
AI is making benchmarks more dynamic. Instead of comparing one company to one static average, analytics teams can now create peer clusters by city, cohort, channel, risk band and product category.
1. AI creates contextual benchmarks. A fashion app can benchmark COD users in Tier-2 cities separately from prepaid metro users. A lender can benchmark delinquency by bureau score band, income proxy and acquisition channel.
2. AI detects benchmark breaks earlier. Anomaly detection can flag when fill rate drops in one dark store, fraud rises in one payment rail or churn spikes in one customer cohort before the blended dashboard looks bad.
3. AI links metrics to root causes. LLM-assisted analytics can summarise customer reviews, support tickets and sales-call notes to explain why a numeric benchmark changed. The caveat: under India’s DPDP Act, personal data use must be purpose-limited, consent-aware and securely governed.
Load a company annual report, investor presentation and this lesson into NotebookLM. Ask: “Create a metric tree and sector benchmark checklist for this company, including counter-metrics and likely interview questions.” Then verify every number from the original document before using it.
Interview Relevance
“You are analysing an Indian subscription or D2C company. Its conversion rate is below the industry average. How would you decide whether this is actually a problem?”
Use the phrase “benchmark plus counter-metric.” It signals that you understand both analytics and business economics.
Common Mistake
The biggest mistake is quoting a benchmark without context - for example, saying “2% conversion is bad” without naming sector, funnel stage, cohort or unit economics. It costs candidates because it sounds like dashboard reading, not business thinking. One-line fix: always say the formula, sector context, comparison base and counter-metric before judging performance.
What to Revise Next
Now move from individual metrics to metric architecture. Revise Case Study: Building a Metric Tree for a Subscription Business so you can connect acquisition, activation, retention, revenue and churn into one interview-ready business diagnosis.