
Building a Metric Tree from Revenue Down to Drivers
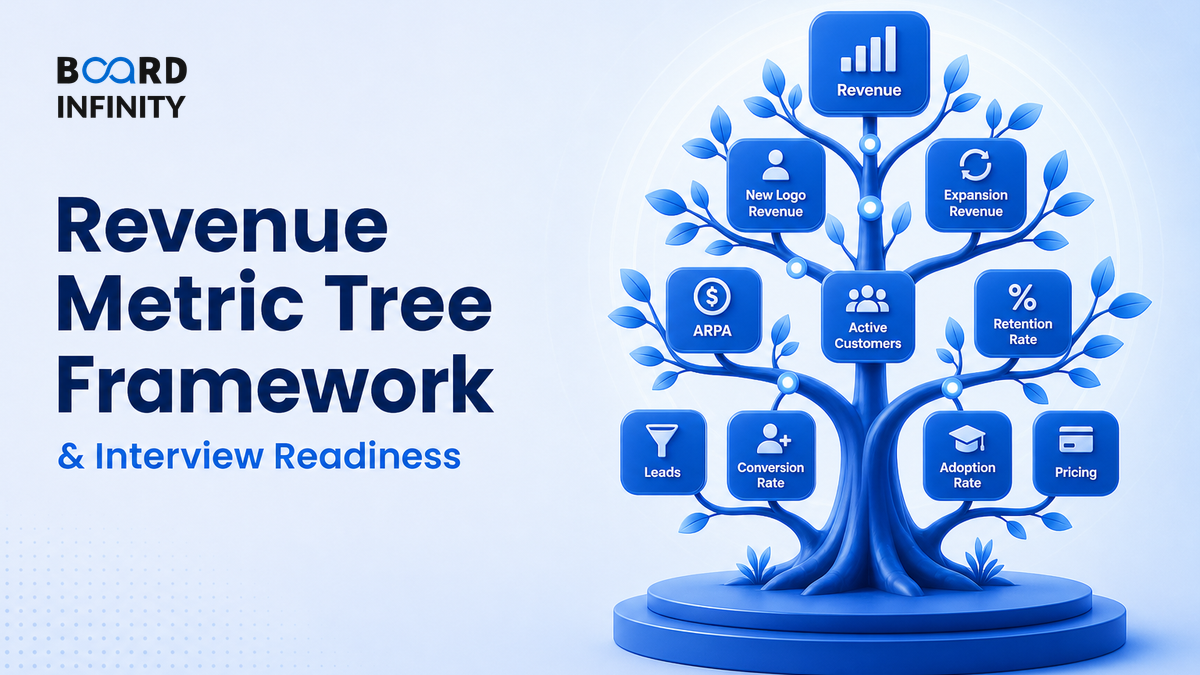
Nykaa can run a beauty sale where app traffic jumps, orders rise, and yet the business still asks a tougher question: did revenue quality improve, or did discounts merely buy short-term volume? That is the job of a metric tree - it forces you to trace every rupee of revenue back to the drivers that actually moved it.
- A metric tree decomposes revenue into mathematical sub-metrics and controllable drivers.
- Start with the top outcome: Revenue = customers × orders per customer × average order value, or the closest equation for that business.
- Separate metrics from drivers: conversion rate is a metric; checkout speed, discounting, assortment and trust are drivers.
- A clean tree is MECE enough: branches should not double-count the same effect, and together they should explain the outcome.
- Use the tree to diagnose gaps: quantify which branch caused the revenue miss before suggesting actions.
- The best interview answer links revenue to acquisition, activation, engagement, retention, pricing and margin quality.
- Biggest trap: listing random KPIs instead of building an equation that reconciles back to revenue.
The Big Picture
A revenue metric tree is a thinking tool for moving from “sales are up or down” to “which controllable lever changed, by how much, and who should act.” The best trees are not fancy dashboards - they are simple equations that connect business outcomes to operating decisions.
Core Explanation: Revenue Down to Drivers
The big idea is simple: revenue is not a single number - it is the output of a system. A metric tree shows the system. At the top is the outcome. Below it are metrics that mathematically explain the outcome. Below those are drivers that teams can influence.
For a digital commerce business, a useful first cut is:
Revenue = Sessions × Conversion Rate × Average Order Value
For a subscription business, it may be:
Revenue = Active Subscribers × Average Revenue per User
For a lending business, it may be:
Revenue = Loan Book × Yield, adjusted for fees, prepayments and risk costs
The equation changes by business model, but the logic stays the same: choose the equation that best reconciles to reported revenue.
The Five-Step Process to Build a Clean Metric Tree
Use these measures as a practical starter pack for a digital commerce or consumer internet revenue tree. The exact benchmark varies by category, ticket size and maturity, so compare against company baseline, cohort trend and margin quality.
Worked Example: Diagnosing a Revenue Gap
Suppose an online beauty store has:
- Sessions = 1,000,000
- Conversion rate = 3%
- Average order value = ₹1,200
Revenue = 1,000,000 × 3% × ₹1,200 = ₹3.6 crore.
If the monthly target is ₹4 crore, the gap is ₹40 lakh. The metric tree tells you the options clearly:
- Increase sessions to about 1.11 million, keeping conversion and AOV unchanged.
- Increase conversion to about 3.33%, keeping sessions and AOV unchanged.
- Increase AOV to about ₹1,333, keeping sessions and conversion unchanged.
A strong candidate then asks: which lever is cheapest, fastest and least damaging to margin? More traffic may raise CAC, higher conversion may require better UX or offers, and higher AOV may require bundles or premium mix.
Metric Tree vs KPI Dashboard
A KPI dashboard tells you what changed. A metric tree tells you why the top metric changed and where to act.
Definitions You Can Say in One Breath
A metric tree decomposes a north-star outcome into mathematical sub-metrics and controllable drivers for diagnosis and action.
A driver is an input teams can change that predictably moves a metric.
A north-star metric is the single outcome that best captures customer value delivered and business growth created.
A KPI is a quantifiable measure used to evaluate progress toward a specific objective.
Case Study: Nykaa Builds Revenue Through Multiple Drivers
Nykaa shows how a beauty commerce business can grow revenue by managing acquisition, conversion, repeat purchase, assortment, private labels and offline trust together.

Situation: Beauty and personal care is not a simple “traffic equals sales” category. Customers care about authenticity, shade discovery, reviews, influencer-led education, replenishment cycles and brand assortment. That means top-line revenue depends on both demand generation and trust-building.
The move: Nykaa built an integrated model: a content-led app and website for discovery, a wide brand marketplace, its own private-label portfolio, loyalty and repeat-purchase nudges, and offline stores that support trial and trust. The primary driver was category trust and curated discovery. Supporting drivers included assortment depth, influencer and content marketing, repeat purchase loops, omnichannel presence and higher-value baskets through premium beauty and personal care.
Outcome or lesson: The lesson is not “Nykaa grew because of marketing.” A better metric-tree answer is: revenue improved when acquisition brought relevant users, activation converted them through trust and assortment, retention encouraged replenishment, and AOV improved through premium mix and bundles.
Takeaway: A metric tree prevents shallow explanations. It shows that revenue growth comes from a system of primary and supporting drivers, not one heroic lever.
How AI Changes Building a Metric Tree from Revenue Down to Drivers
AI does not replace the metric tree. It makes the tree faster to build, easier to query and more dangerous if you skip business judgement.
- Natural-language diagnostics: Business users can ask, “Why did revenue fall in the West region last week?” and AI can scan dashboards, cohorts and transactions to surface likely branches such as traffic, conversion, AOV or repeat purchase.
- Driver discovery: Machine learning can detect hidden relationships - for example, checkout latency, stock-outs, return rates or discount depth influencing conversion and repeat purchase.
- Scenario simulation: AI-assisted models can estimate the revenue impact of changing conversion, AOV, retention or CAC, but the output must be checked against business constraints like margin, inventory and customer experience.
When AI is used on metric trees, track whether it improves diagnosis quality rather than only dashboard speed.
Load the company annual report, investor presentation and this lesson into NotebookLM. Ask: “Build a revenue metric tree for this company, list likely interview questions, and flag which drivers are measurable from public information.” Then use ChatGPT or Claude to pressure-test whether the tree mathematically reconciles to revenue.
Interview Relevance
“Suppose an e-commerce company’s revenue declined 10% last month. Build a metric tree to diagnose the issue and suggest what you would check first.”
Use the phrase: “I will first create a mathematically reconcilable tree, then identify the largest variance branch, then move from metric diagnosis to controllable drivers.” That sounds structured and senior.
Common Mistake
The common mistake is building a “Christmas tree” of random KPIs - traffic, NPS, app downloads, CAC, retention, discounting - without showing how they mathematically connect to revenue. It costs candidates because the answer becomes a dashboard, not a diagnosis. Fix: start with one revenue equation, make every branch reconcile upward, and only then add drivers.
What to Revise Next
Once you can build the revenue tree, revise the two branches interviewers most often probe next: how customers enter the system, and whether they stay long enough to create value.