
The North Star Metric and the Counter-Metrics That Protect It
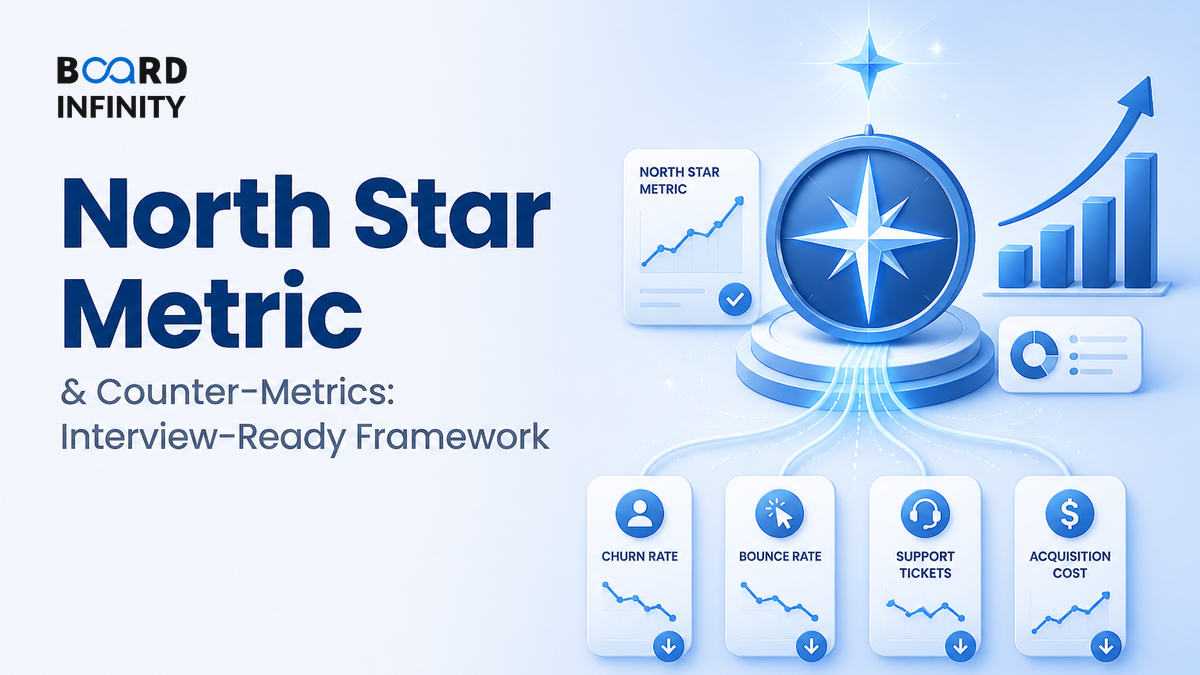
A product team can celebrate a beautiful before-and-after chart: transactions up, app installs up, dashboards all green. Then the aftershock arrives - failed payments, angry users, rising refunds, or profitless growth. The North Star Metric gives a team one direction; counter-metrics make sure it does not sprint off a cliff.
- North Star Metric is the one metric that best captures repeated customer value and long-term business progress.
- A good North Star is not revenue by default; it should reflect the value users came for, such as successful payments, completed rides, or lessons learned.
- Input metrics are the controllable levers that move the North Star - acquisition, activation, frequency, conversion, retention.
- Counter-metrics are guardrails that prevent unhealthy growth - quality, trust, unit economics, compliance, and customer experience.
- The best answer is a metric stack: North Star at the top, input drivers below, counter-metrics around it.
- Vanity metrics look impressive but do not prove value - downloads, impressions, registered users, gross GMV without repeat usage or margin.
- In interviews, always say: “I would optimize the North Star subject to guardrails, not maximize it blindly.”
Big Picture: One Metric to Focus, Guardrails to Protect
The North Star Metric is the team’s compass, but it is not the whole dashboard. Think of it as a value engine: inputs feed it, and counter-metrics protect it from creating hidden damage.
For metrics, do not pretend one benchmark fits every product. The ranges below are practical B2C digital-product heuristics; in a real answer, replace them with category, cohort, and company benchmarks.
The Core Explanation: Metric Discipline, Not Metric Worship
A North Star Metric works because it translates strategy into one observable behavior. If Spotify chooses only “app opens,” teams may chase notifications. If it chooses “time spent with satisfied listening sessions,” it gets closer to customer value. If a payments app chooses only transaction count, it may ignore failed transactions and fraud.
So the discipline is not “pick one number and worship it.” The discipline is: choose one value metric, decompose it into drivers, and protect it with counter-metrics.
Duolingo’s growth is not explained by one magic number like downloads. Its engagement comes chiefly from repeated learning behavior, supported by bite-sized lessons, streak mechanics, adaptive practice, notifications, and a playful product experience. The strategic so what: a North Star should capture the repeated value event, while the supporting system explains why that event keeps happening.
North Star vs Vanity Metric: The Two-Sided Comparison
A vanity metric makes the graph look good. A North Star metric makes the business healthier. The difference is whether the metric proves repeated value, not just attention.
The Metric Stack: North Star, Inputs, and Counter-Metrics
A strong product metrics answer has three layers. The top says what matters. The middle says what teams can act on. The outer guardrails say what must not break.
Choosing Counter-Metrics: What They Must Protect
Counter-metrics are not “extra KPIs.” They are the non-negotiables that stop the North Star from being gamed. Choose them by asking: if this metric rises too fast, what could break?
A Small Worked Example: When Growth Is Not Healthy
Suppose a food-delivery product chooses “completed orders per week” as its North Star. A promotion increases completed orders from 100,000 to 125,000 in one week.
The correct conclusion is not “promotion worked.” It is: “The North Star increased, but counter-metrics show unhealthy growth; I would refine targeting, reduce discount leakage, and improve fulfillment quality before scaling.”
Definitions
- North Star Metric: the single metric that best captures repeated customer value and sustainable business progress.
- Input metric: a controllable driver that influences the North Star, such as activation, frequency, or retention.
- Counter-metric: a guardrail metric that prevents growth in the North Star from damaging quality, trust, economics, or compliance.
- Vanity metric: a number that looks impressive but does not reliably prove customer value or guide decisions.
- Metric tree: a decomposition of one outcome metric into its mathematical and behavioral drivers.
PhonePe: Growing a Payments North Star Without Breaking Trust
PhonePe shows why a payments business cannot optimize only for transaction volume; the real challenge is scaling successful, trusted payments on India’s UPI rails.

Situation. In India’s UPI ecosystem, payment apps compete in a high-frequency, low-friction category. Users expect instant success at kirana stores, restaurants, online checkouts, and peer-to-peer transfers. A simple North Star like “number of transactions” is tempting because it is visible and easy to rally teams around.
The move. A stronger PhonePe metric system would treat “successful payment transactions by active users and merchants” as the value outcome, then protect it with hard counter-metrics: transaction success rate, fraud or abuse signals, customer complaints, uptime, bank or rail reliability, merchant repeat usage, and compliance with RBI and NPCI expectations.
Outcome or lesson. The strategic lesson is that payments growth is chiefly driven by trust in successful completion, supported by merchant acceptance, bank integrations, low-friction UX, risk controls, rewards or discovery loops, and reliable infrastructure. If the app maximizes transaction attempts but failures or fraud rise, the North Star has been gamed.
The case gives you a clean interview line: “For PhonePe, I would not celebrate UPI transaction attempts alone. I would optimize successful, trusted transactions, subject to reliability, fraud, complaint, and cost-to-serve guardrails.”
How AI Changes the North Star Metric and Counter-Metrics
1. AI can personalize the path to the North Star. Recommendation models can decide which offer, onboarding step, nudge, or content unit is most likely to move a user toward the core value event. The risk is short-term manipulation, so AI-led experiments need counter-metrics like complaint rate, opt-outs, retention quality, and margin impact.
2. AI improves anomaly detection on guardrails. Instead of waiting for a weekly dashboard, ML systems can flag sudden spikes in failed payments, cancellations, fraud patterns, refund requests, or app crashes. This makes counter-metrics more operational - they become early-warning systems, not post-mortem numbers.
3. LLMs make metric trees easier to build, but easier to hallucinate. A product manager can ask an LLM to decompose revenue, retention, or successful transactions into drivers. But the human must verify definitions, denominator logic, and whether the proposed North Star truly represents customer value.
Use ChatGPT or Claude to practise: paste a company description and ask, “Propose one North Star Metric, five input metrics, and five counter-metrics with formulas.” Then challenge the output by asking, “Which of these are vanity metrics, and what guardrail could stop gaming?”
Interview Relevance
“You are the product manager for an Indian payments app. What North Star Metric would you choose, and what counter-metrics would you track?”
Use the phrase “optimize subject to guardrails.” It signals maturity because real companies rarely maximize one metric without constraints.
Common Mistake
The biggest mistake is choosing a shiny output like downloads, GMV, impressions, or total users and calling it the North Star. It costs candidates because it shows they cannot separate activity from value. Fix it in one line: “I will choose a repeated customer value event as the North Star, then protect it with counter-metrics for quality, trust, economics, and reliability.”
What to Revise Next
Now move from choosing the right metric to building the system underneath it. Revise Building a Metric Tree from Revenue Down to Drivers to learn decomposition, then Acquisition Metrics and Cost per Customer to connect growth to efficiency.