
Market Risk for Interviews: Master VaR, Expected Shortfall & Stress Testing
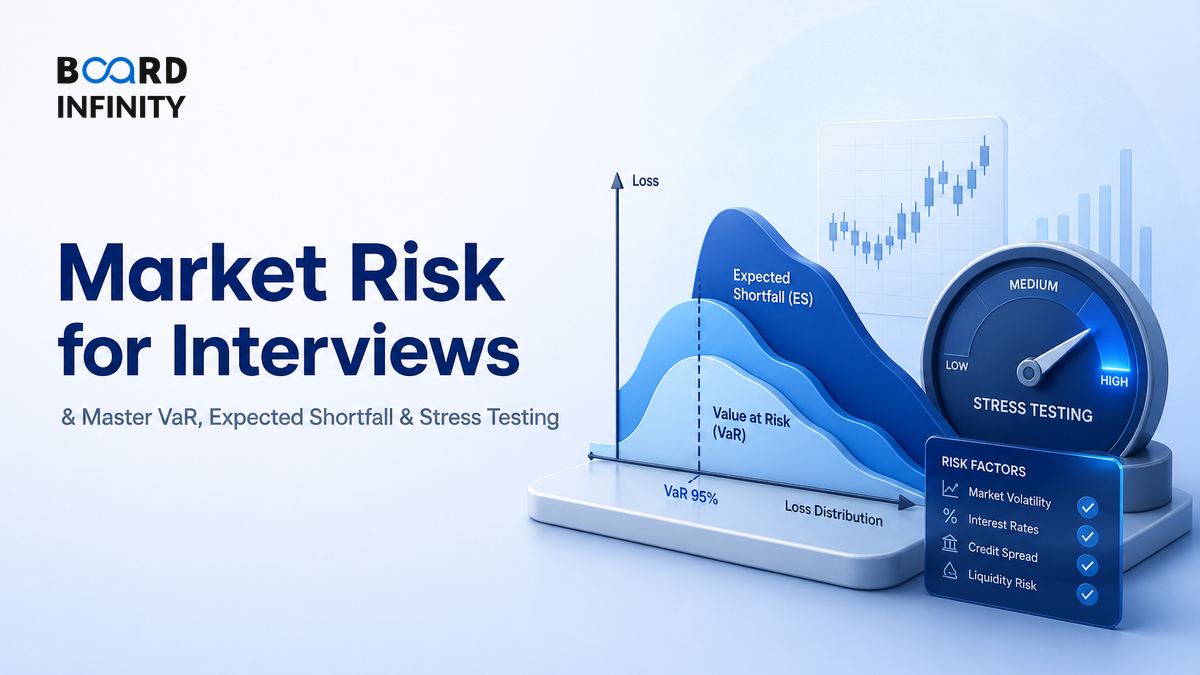
At 9:15 a.m., a treasury dealer watches the 10-year government bond yield jump, the equity index gap down, and the rupee move sharply against the dollar. The portfolio has not changed - but its value has. That invisible loss, created by moving market prices, is exactly what market risk tries to measure before it becomes a headline.
- Market risk is the risk of loss from changes in market prices - interest rates, equity prices, FX rates, commodities and credit spreads.
- Value at Risk answers: “How much can I lose on a bad day, at a chosen confidence level?”
- Expected Shortfall answers the better tail question: “If things are worse than VaR, what is the average loss?”
- Stress testing asks: “What if a rare but plausible shock hits - rate spike, currency crash, equity sell-off, liquidity freeze?”
- VaR is useful for limits and communication, but it does not show how bad the tail can be after the cutoff.
- Expected Shortfall is more tail-aware, which is why Basel’s Fundamental Review of the Trading Book uses ES instead of VaR for market-risk capital.
- The strongest interview answer links VaR + ES + stress testing + backtesting as one risk-control system, not three separate formulas.
Big Picture: The Three-Layer View of Market Risk
Think of market risk measurement as a narrowing funnel. Most days are normal noise, VaR focuses on the bad-but-not-catastrophic cutoff, Expected Shortfall looks beyond that cutoff, and stress testing deliberately jumps to extreme scenarios that historical data may not fully contain.
Core Explanation: VaR, Expected Shortfall and Stress Testing Work as a System
Market risk arises because financial positions are marked to market. A bond loses value when yields rise, an importer suffers when the rupee weakens, an equity book loses when prices fall, and a commodity exposure moves with crude, metals or agricultural prices.
The three tools answer three different questions:
- VaR: What is the loss threshold we should not exceed most of the time?
- Expected Shortfall: When we do exceed that threshold, how painful is the average tail loss?
- Stress testing: What happens under severe, plausible scenarios that may not appear in recent data?
Value at Risk: The Loss Number Everyone Understands - and Often Misuses
Value at Risk converts portfolio risk into one number: a loss amount, over a time horizon, at a confidence level. A statement like “1-day 99% VaR is ₹10 crore” means: under the model, losses are expected to exceed ₹10 crore on about 1% of trading days.
Three inputs must always be stated, otherwise VaR is incomplete:
- Time horizon: 1 day, 10 days, 1 month, etc.
- Confidence level: commonly 95%, 99% or 99.9% depending on use.
- Method: historical simulation, variance-covariance or Monte Carlo.
Expected Shortfall: The Tail-Risk Upgrade
VaR tells you the boundary of bad outcomes, but not the severity beyond it. If two portfolios both have 99% VaR of ₹10 crore, one could have tail losses around ₹11 crore while another could have tail losses around ₹50 crore. VaR alone treats them as similar; Expected Shortfall does not.
Expected Shortfall, also called Conditional VaR, is the average loss conditional on losses being worse than VaR. It is more informative for crisis risk because it asks, “When the bad 1% happens, how bad is it on average?”
Basel’s Fundamental Review of the Trading Book moved market-risk capital from VaR to Expected Shortfall because ES captures tail severity better. The strategic point: banks need capital for extreme losses, not just the cutoff before extreme losses begin.
Stress Testing: The Scenario Question VaR Cannot Answer
Stress testing deliberately breaks the “normal market conditions” assumption. It estimates the impact of extreme but plausible market moves - for example, a sudden interest-rate spike, equity-market crash, oil-price shock, currency depreciation, credit-spread widening or multiple shocks together.
Good stress tests usually include:
- Historical scenarios: replay a real crisis, such as a global financial crisis, Covid sell-off or taper-tantrum-style rate shock.
- Hypothetical scenarios: design a forward-looking shock, such as “oil rises sharply while INR weakens and rates rise.”
- Reverse stress tests: start with failure - “What market move would breach capital or liquidity limits?” - and work backwards.
- Combined shocks: test correlation breakdown, not just one risk factor moving alone.
The Market Risk Control Process
A professional market-risk desk does not stop at calculating VaR. It defines risk factors, measures exposure, sets limits, backtests the model, escalates breaches and runs stress tests. That is the answer structure interviewers like because it sounds like a control system, not a textbook formula.
Key Market Risk Metrics to Track
Use these metrics when an answer asks how market risk is measured, monitored or controlled. Notice that some metrics have no universal “good” value because the right number depends on capital, liquidity, business model and board-approved risk appetite.
Worked Example: Calculating Historical VaR and Expected Shortfall
Suppose a bank has 250 days of daily trading PnL for a bond portfolio. To estimate 1-day 99% historical VaR, sort daily PnL from worst to best.
The interpretation is simple: VaR says “the cutoff is ₹4.2 crore”; Expected Shortfall says “when we cross the cutoff, the average tail loss is about ₹4.83 crore.”
Definitions You Can Say in One Breath
- Market risk: The risk of loss from adverse movements in market prices such as rates, FX, equities, commodities or spreads.
- Value at Risk: Philippe Jorion: “the worst expected loss over a given horizon under normal market conditions at a given confidence level.”
- Expected Shortfall: The average loss conditional on the loss exceeding VaR at a chosen confidence level.
- Stress testing: A scenario-based estimate of portfolio loss under extreme but plausible market shocks.
- Backtesting: Comparing model-predicted losses with actual outcomes to check if the risk model is reliable.
Case Study: NSE Clearing and India’s Market-Risk Safety Net
NSE Clearing turns market risk into upfront collateral through VaR margins, extreme loss margins, mark-to-market settlement and stress testing - a practical Indian example of risk measurement becoming market infrastructure.

Situation: In India’s cash equity and derivatives markets, millions of trades are cleared through a central clearing corporation. If a trading member or client cannot meet obligations after a sharp market move, the loss can threaten the settlement chain. The risk is not only price volatility; it is volatility plus time-to-settle plus member default risk.
The move: NSE Clearing uses a layered defence. In cash equities, VaR-based margins estimate normal adverse price movement. Extreme Loss Margin adds a buffer for losses beyond the regular VaR estimate. Mark-to-market settlement collects losses as prices move. For derivatives, margining frameworks such as SPAN-style risk arrays estimate losses across multiple price and volatility scenarios. The clearing corporation also runs stress tests to judge whether collateral, margins and default resources can withstand severe market moves.
The lesson: This is market risk management in its most operational form. VaR gives a measurable starting point, but the system is stronger because it is supported by extreme loss margins, daily mark-to-market discipline, member-level exposure controls, surveillance actions and stress testing. The primary driver is upfront risk-based collateral; supporting drivers are real-time monitoring, margin add-ons, settlement discipline and default-management resources.
The strategic takeaway: in real financial markets, risk models matter only when they are tied to limits, collateral, settlement and escalation.
How AI Changes Market Risk: Value at Risk, Expected Shortfall & Stress Testing
AI is not replacing market-risk governance, but it is changing how quickly institutions detect, explain and simulate risk.
- Faster scenario generation: Generative AI can help risk teams draft plausible stress narratives - for example, “oil shock plus INR depreciation plus foreign portfolio outflows” - which quants then convert into numerical shocks.
- Intraday anomaly detection: Machine-learning models can flag unusual movements in rates, FX, volatility surfaces or correlations earlier than end-of-day reporting.
- Better risk explanation: LLMs can summarize why VaR moved - higher volatility, larger position, correlation shift, yield-curve move - but the numbers must still come from approved risk engines.
Use NotebookLM or Claude for revision: upload this lesson plus a bank’s annual report or Pillar 3 disclosure, then ask, “List every market-risk metric disclosed, explain what each means, and create five interview questions on VaR, stress testing and treasury risk.” Verify all figures against the original document.
Interview Relevance
“Explain VaR, Expected Shortfall and stress testing. If VaR already measures risk, why do banks still need Expected Shortfall and stress tests?”
Use the phrase “VaR is a quantile, not a worst-case loss.” It instantly shows you understand the concept beyond the formula.
Common Mistake
The biggest mistake is saying VaR is “the maximum loss.” That is wrong and costly because losses can exceed VaR exactly in the tail you care about. The fix: say “VaR is a loss threshold at a confidence level; Expected Shortfall and stress tests show what happens beyond it.”
What to Revise Next
Once market risk is clear, move to the other balance-sheet risks that often appear with it. First revise how borrowers and counterparties fail, then how funding mismatches turn solvency into a liquidity crisis.