
Business Models: How Energy & Renewables Players Make Money
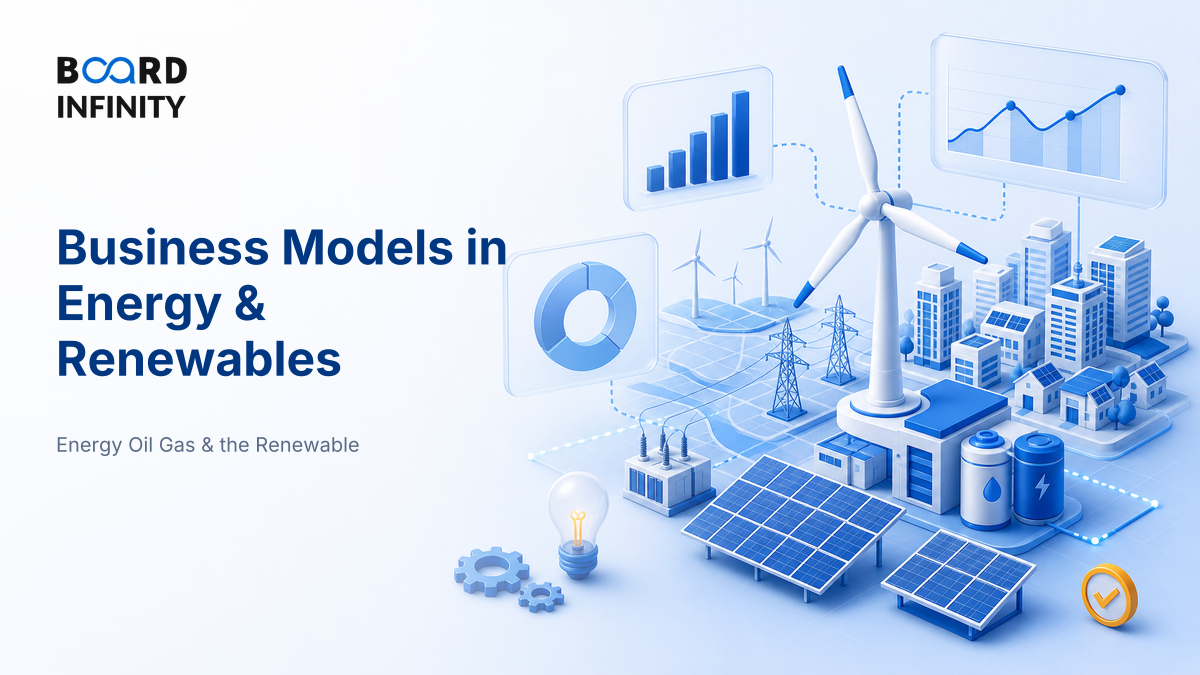
A coal plant earns only when fuel, dispatch and tariff all work together; a solar farm can earn predictable cash flows for decades if its power purchase agreement is bankable. Same product - electricity - but completely different business model logic.
That is the first unlock in energy and renewables: the money is not just in generating units of power. It is in who owns the asset, who takes price risk, who signs the contract, who finances the capex, and who controls flexibility when the grid is stressed.
- Energy business models convert physical assets into contracted cash flows. The key question is: who pays, for what, and with what risk?
- Renewable IPPs earn mainly through long-term power purchase agreements, where revenue is tariff multiplied by energy generated.
- Merchant power earns through market prices, so upside is higher but cash-flow certainty is lower.
- Utilities and DISCOMs make money through regulated tariffs, distribution margins, or allowed returns, not pure free-market pricing.
- EPC, OEM, O&M and asset-management players earn fee or margin income without always owning the generation asset.
- Storage, hybrid and firm renewable models are increasingly paid for reliability, peak power and grid flexibility - not only cheap green units.
- Best interview answer: map the player to asset ownership, customer, contract type, revenue formula, key costs, risks and metrics.
Big Picture - Follow the Cash, Not the Technology
A wind turbine, a gas plant, a battery and a power distribution company all sit in the same sector, but their business models differ sharply. Start with the cash-flow chain: asset, buyer, contract, revenue, cost and risk.
If you remember only one sentence, make it this: energy companies make money by converting capital-intensive infrastructure into either contracted, regulated or market-linked cash flows.
The Core Business Models in Energy & Renewables
The sector is best understood as a set of business models, not as one industry. The same company may run multiple models at once - for example, owning renewable assets, selling power to corporate customers, and adding storage to improve reliability.
The clean way to explain any company is not “it is in solar” or “it is in power.” Say: it owns X assets, sells to Y customer, under Z contract, and earns through this formula.
Conventional Power vs Renewables - The Business Model Contrast
The biggest contrast is where uncertainty sits. A thermal plant worries heavily about fuel availability, fuel price and emissions constraints. A renewable project worries more about intermittency, grid evacuation, offtaker credit and financing cost.
This is why “renewables are cheaper” is not a complete business-model answer. A renewable project can still struggle if the PPA is weak, receivables are delayed, grid evacuation is constrained, or leverage is too high.
The Revenue Formulas You Should Be Able to Say
Most interview answers become stronger when you can express the revenue model in one line. Use these as mental formulas.
A Mini Worked Example - PPA Economics in 60 Seconds
Assume a hypothetical 100 MW solar plant has a capacity factor of 22 percent and sells power under a PPA at ₹3 per kWh. Annual generation is:
100 MW × 8,760 hours × 22% = 192,720 MWh, or 192.72 million kWh.
Annual revenue becomes:
192.72 million kWh × ₹3 = ₹578.16 million, or about ₹57.8 crore.
If operating cost is hypothetically ₹0.40 per kWh, annual operating cost is about ₹7.7 crore. So operating cash before land lease, transmission, corporate overheads, taxes and debt service is roughly ₹50.1 crore.
The lesson is simple: for renewable assets, small changes in capacity factor, tariff, curtailment or receivable delays can materially change returns because the asset is capex-heavy and debt-funded.
The Risk-Return Map of Energy Business Models
Energy business models sit on a spectrum. Long-term contracted renewables may offer lower upside but better visibility. Merchant or storage-linked models may offer higher upside but more exposure to market design and price volatility.
This is also where regulation matters. In India, tariffs, open access, grid charges, renewable purchase obligations and power trading rules can affect whether a model is profitable. If you are revising sector regulation, use Locating the Regulator and What It Controls to identify whether the relevant body is central, state-level or market-facing.
Key Metrics That Reveal Whether the Model Works
Do not throw metrics randomly. Pick the metric that matches the model. A PPA-backed solar asset, a DISCOM and a storage operator are not judged the same way.
For placement answers, do not quote a universal “good” number without context. Solar, wind, thermal, hydro, storage and distribution each have different benchmarks. The smart move is to say: “I would benchmark this metric against the PPA model, technology type, geography and peer set.” To build that peer view fast, practise with Reading an Annual Report for Sector Insight.
Definitions You Must Know Cold
- Business model: “A business model describes the rationale of how an organization creates, delivers, and captures value.” - Osterwalder and Pigneur, Business Model Generation
- Power Purchase Agreement: A contract where an offtaker agrees to buy electricity from a generator on specified commercial terms.
- Independent Power Producer: A non-utility generator that owns or operates power assets and sells electricity to buyers.
- DISCOM: A distribution company that purchases electricity and supplies it to end customers within a licensed area.
- Merchant power: Electricity sold at market-linked prices rather than under a fixed long-term contract.
- LCOE: The average lifetime cost of generating one unit of electricity from an asset.
Case Study - ReNew: From Green Megawatts to Contracted Cash Flows
ReNew shows how a renewable energy player creates value by developing, owning and operating assets, then monetising them through long-term power contracts and newer firm-power solutions.
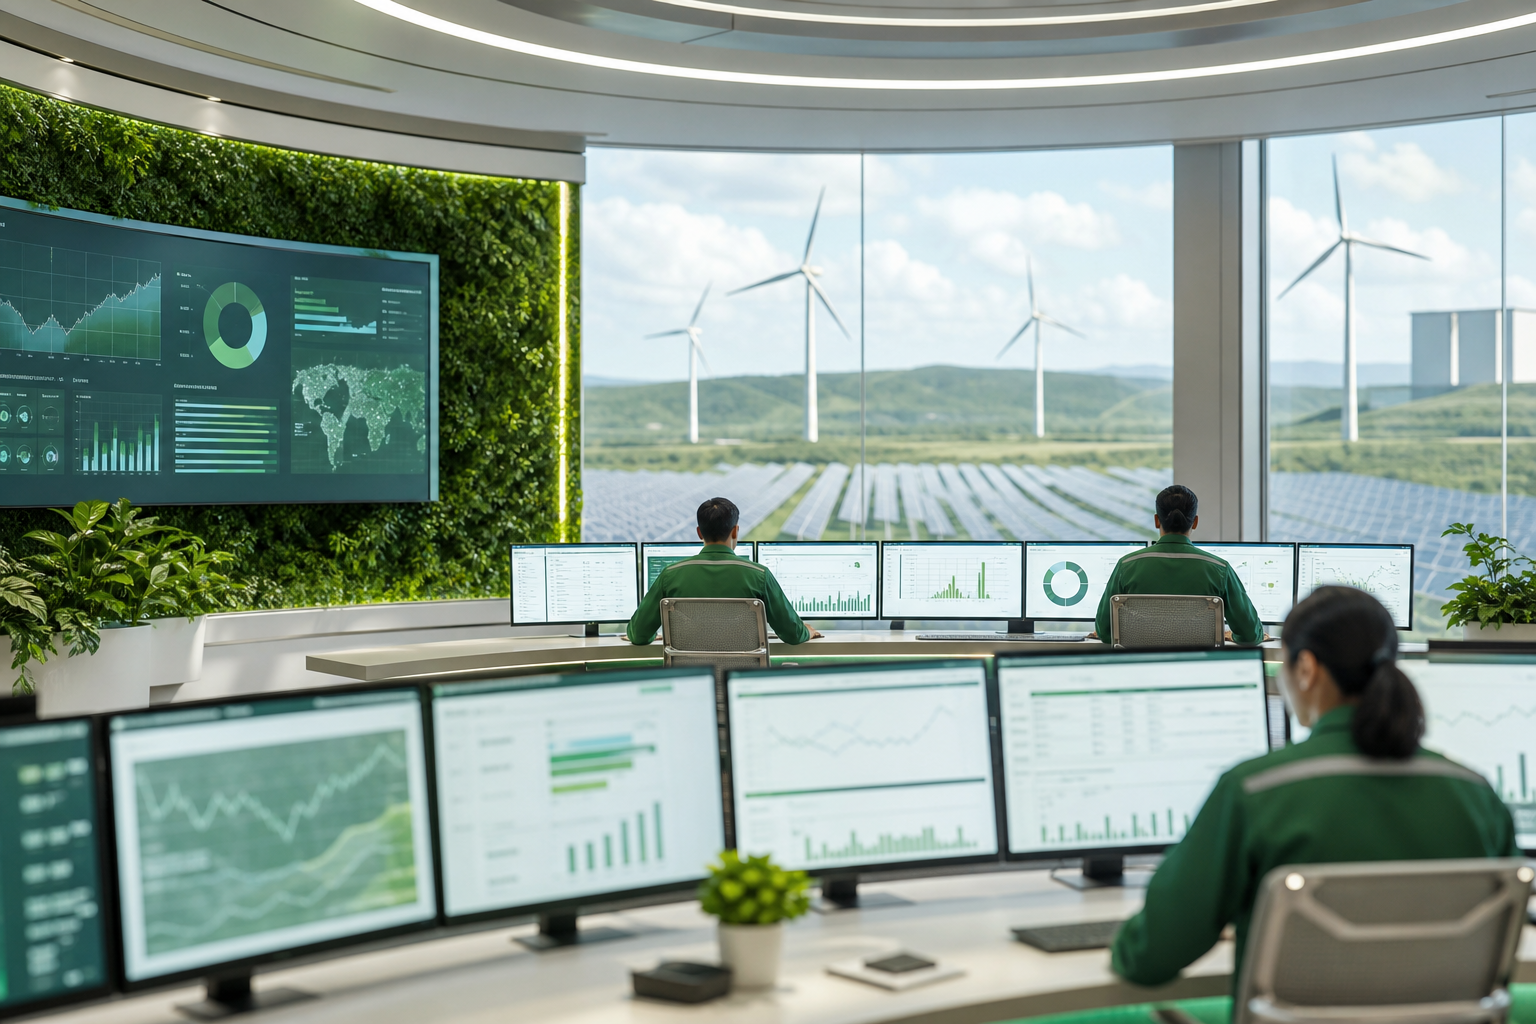
ReNew is a useful case because it is not just a “solar company.” It is a renewable energy platform. In its public filings, ReNew describes a business built around developing, owning and operating utility-scale wind and solar projects, with electricity sold largely through long-term contracts (ReNew SEC filings).
Situation: India needed large-scale renewable capacity, but utility-scale renewables are capital-intensive. Investors and lenders needed predictable cash flows, not just a sustainability story.
The move: ReNew built a portfolio model: multiple renewable assets, long-term offtake arrangements, project financing, professional O&M, and increasing focus on solutions that make renewable power more reliable for customers. The primary driver was bankable contracted revenue. Supporting drivers included scale, access to capital, project-development capability, resource assessment, operating discipline and portfolio diversification across sites and technologies.
The lesson: The business model is not “generate green electricity and sell it.” The sharper answer is: ReNew converts renewable resource potential into financed, contracted infrastructure cash flows, while gradually moving up the value curve toward firmer and more customer-specific clean power solutions.
If you want to compare ReNew with another energy player in a structured way, use the same dimensions you would use in Comparing Two Sectors on the Same Framework: customer, revenue model, cost structure, regulation, risk and metrics.
How AI Changes Energy & Renewables Business Models
AI is not a separate business model by itself. It improves the economics of existing models by improving forecasting, asset performance and decision speed.
- Better generation and demand forecasting: AI models improve solar, wind and load forecasting, helping generators schedule power more accurately and reduce imbalance exposure.
- Predictive maintenance: Turbine, inverter, transformer and battery data can be used to predict failures earlier, raising availability and reducing downtime.
- Smarter bidding and dispatch: For merchant, hybrid and storage assets, AI can support price forecasting, battery charge-discharge decisions and peak-hour dispatch planning.
Use NotebookLM for a company-specific prep sprint: upload the company annual report, an investor presentation and one regulator note, then ask: “Map this company’s business models, revenue formulas, top risks and five likely interview questions.” Cross-check every specific number against the original document before using it.
The caution: AI can summarise filings quickly, but it may confuse capacity, generation, revenue and profit. For sector research without importing errors, revise Using AI to Research a Sector Without Importing Its Errors.
Interview Relevance
“Pick any energy or renewables company. Explain its business model and the key risks to profitability.”
If the interviewer names a company, do not start with technology. Start with monetisation: “This company earns through asset ownership, long-term contracts and operating performance; the key risks are offtaker payment, generation variability and leverage.”
Common Mistake
The mistake: saying “renewable companies make money by selling electricity” and stopping there. That answer misses the actual business model - contract type, customer credit, tariff, financing, curtailment and regulatory risk. One-line fix: always explain asset owner + customer + contract + revenue formula + risk owner.