
Energy & Renewables at a Glance: Size, Growth & Structure
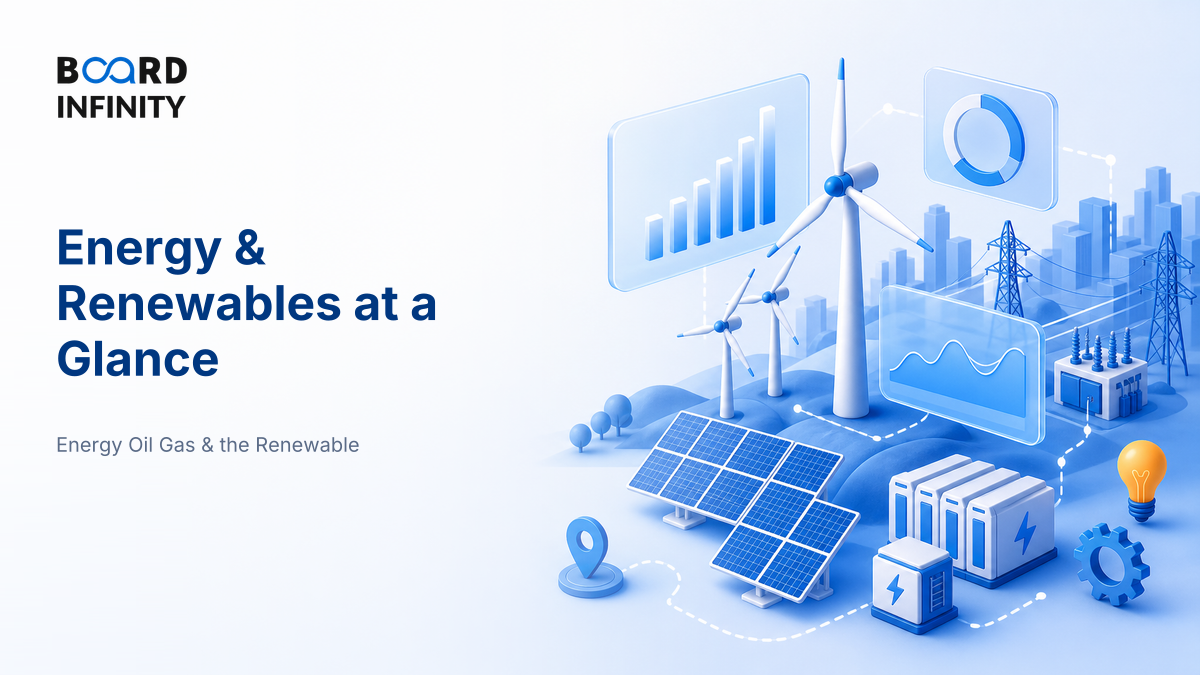
Renewables are often described as “just solar and wind getting cheaper.” That is the first misconception to kill: the energy sector is a giant system of fuels, power plants, grids, storage, financiers, regulators and consumers - and renewables change the whole system, not just the fuel source.
- Energy is broader than electricity: it includes transport fuels, industrial heat, cooking, power generation and storage.
- Renewables are not one market: split solar, wind, hydro, bioenergy, storage, green hydrogen, equipment, EPC, developers and grid services.
- Size the sector using five lenses: primary energy demand, electricity generation, installed capacity, investment flow and end-user demand.
- Growth is driven by demand, policy, technology cost decline, energy security and corporate decarbonisation.
- Structure matters: generation may be competitive, transmission and distribution are often regulated, and storage creates new value pools.
- The biggest interview trap: quoting installed capacity as if it equals actual electricity supplied.
- Best answer frame: size the market, explain the growth loop, map the value chain, name the bottlenecks, then identify where profits can be made.
Big Picture: Think System, Not Solar Panel
The cleanest way to understand energy and renewables is to separate what is consumed, how it is produced, how it moves and who controls the economics. If you need a practical method for estimating a sector when exact numbers are unavailable, revise sizing a sector when no number exists.
Core Explanation: Size, Growth and Structure
Energy sector size is the total economic activity around producing, transporting, storing and consuming energy. In interviews, do not give one number and stop. Show the interviewer which “size” you mean.
1. How to Size the Energy and Renewables Sector
Use five lenses. Each lens answers a different business question.
The International Energy Agency expects global renewable power capacity to grow by 2.7 times by 2030 under its main case, close to but below the COP28 tripling ambition (IEA Renewables 2024). For India, the clean-energy growth story is also policy-backed: India’s updated NDC targets about 50% cumulative electric power installed capacity from non-fossil fuel-based energy resources by 2030 (PIB, 2022).
2. The Growth Loop: Why Renewables Keep Expanding
Renewables grow through a reinforcing loop. Policy creates demand certainty, demand creates project scale, scale improves supply chains and financing, lower costs create more demand, and the loop repeats. The loop can break when grids, land, finance or distribution companies become bottlenecks.
3. The Structure: Who Does What?
The energy and renewables sector has multiple layers. Each layer has a different risk-return profile.
For a deeper next layer after this overview, revise how value chains are mapped using the same logic as reading an annual report for sector insight: identify revenue lines, assets, customers, regulation and risks.
4. Where Value Pools Sit
A simple way to compare opportunities is to ask two questions: Is revenue predictable? And is the business differentiated?
Definitions You Must Get Right
The United Nations defines renewable energy as “energy derived from natural sources that are replenished at a higher rate than they are consumed.”
Key Sector Metrics: What to Track
Energy interviews reward candidates who can separate technical, commercial and financial metrics. Benchmarks vary sharply by technology, geography and contract design, so the safest answer is to define the measure, compare it against its own project assumptions and then explain the business implication.
Worked Example: Capacity Is Not Generation
Suppose a hypothetical solar project has 1,000 MW capacity and a 22% assumed CUF. Annual generation would be:
1,000 MW x 8,760 hours x 22% = 1,927,200 MWh, or about 1.93 TWh.
The interview point: a 1 GW solar project does not generate 1 GW every hour. Its actual output depends on sunlight, technology, grid availability, curtailment and maintenance.
Case Study: Suzlon and the Capital-Goods Side of Renewables
Suzlon shows why renewables are not only about power producers - the sector also depends on equipment manufacturing, services, balance sheets and policy-linked demand.
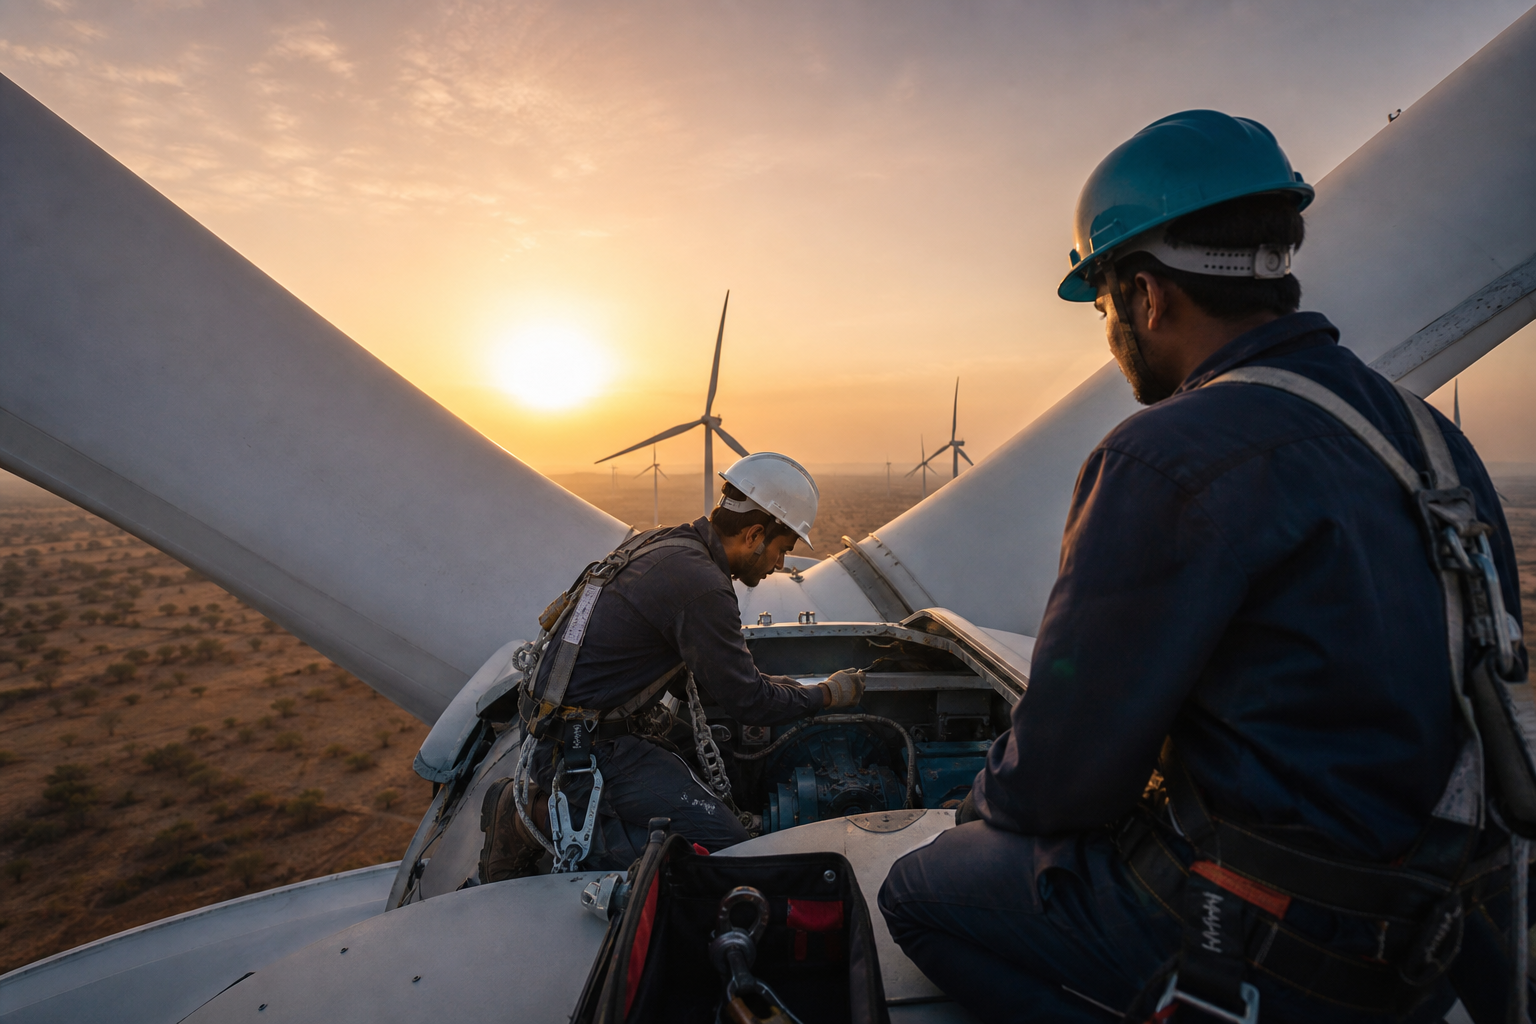
Situation: India’s renewable ambitions created long-term demand for wind and hybrid power, but wind equipment is a cyclical, capital-intensive business. Turbine manufacturers need orders, working capital, component supply chains, installation capability and long-term service income.
The move: Suzlon has positioned itself across wind turbine manufacturing and operations and maintenance, while also communicating deleveraging and order execution priorities through its investor disclosures (Suzlon annual reports). The primary driver is not “renewables are growing” alone. The primary driver is participation in the wind OEM and service layer of the value chain, supported by India’s clean-energy policy direction, domestic manufacturing capability, an installed base that needs servicing and improving balance-sheet discipline.
Outcome or lesson: The case teaches a mature interview answer: renewable growth creates opportunities beyond generation. Some players win by owning assets, some by manufacturing equipment, some by financing projects, and some by servicing the installed base. The profit pool depends on where the company sits in the structure.
So what: A shallow candidate says, “Suzlon benefits because wind energy is growing.” A strong candidate says, “Suzlon sits in the equipment and O&M layer, so its upside comes from renewable capacity expansion, but its actual performance depends on order conversion, execution discipline, service revenue and capital structure.”
How AI Changes Energy & Renewables
1. AI improves forecasting and dispatch. Solar and wind output are variable. Machine learning models help forecast generation using weather, asset and grid data, which improves scheduling, reduces imbalance penalties and helps system operators plan reserves.
2. AI shifts maintenance from reactive to predictive. Turbines, inverters, transformers and batteries generate operational data. AI can flag vibration anomalies, overheating, underperformance or failure patterns before downtime becomes expensive.
3. AI speeds up sector research and project screening. Students and analysts can use AI to compare policies, map competitors, summarise annual reports and identify regulatory risks - but only if they verify the sources. For a safe workflow, use AI to research a sector without importing its errors.
Load a renewable company’s annual report, one regulator document and this lesson into NotebookLM. Ask: “Create a 2-minute sector overview, list the company’s value-chain position, and generate 10 interview questions with evidence-backed answers.” Then verify every number against the original document.
Interview Relevance
“Give me a two-minute overview of India’s energy and renewables sector. Cover size, growth, structure and where companies make money.”
Use the phrase “capacity is not generation, and generation is not profitability.” It signals that you understand both engineering and business economics.
Common Mistake
The biggest mistake is treating renewables as one simple high-growth bucket and using installed capacity as the only proof. It costs candidates because interviewers know that grid readiness, utilisation, offtake, curtailment and financing decide business outcomes. The fix: always separate capacity, generation, firm supply and profitability.