FMCG careers in India: what the numbers say about jobs, growth and where to start

FMCG careers in India: what the numbers say about jobs, growth and where to start
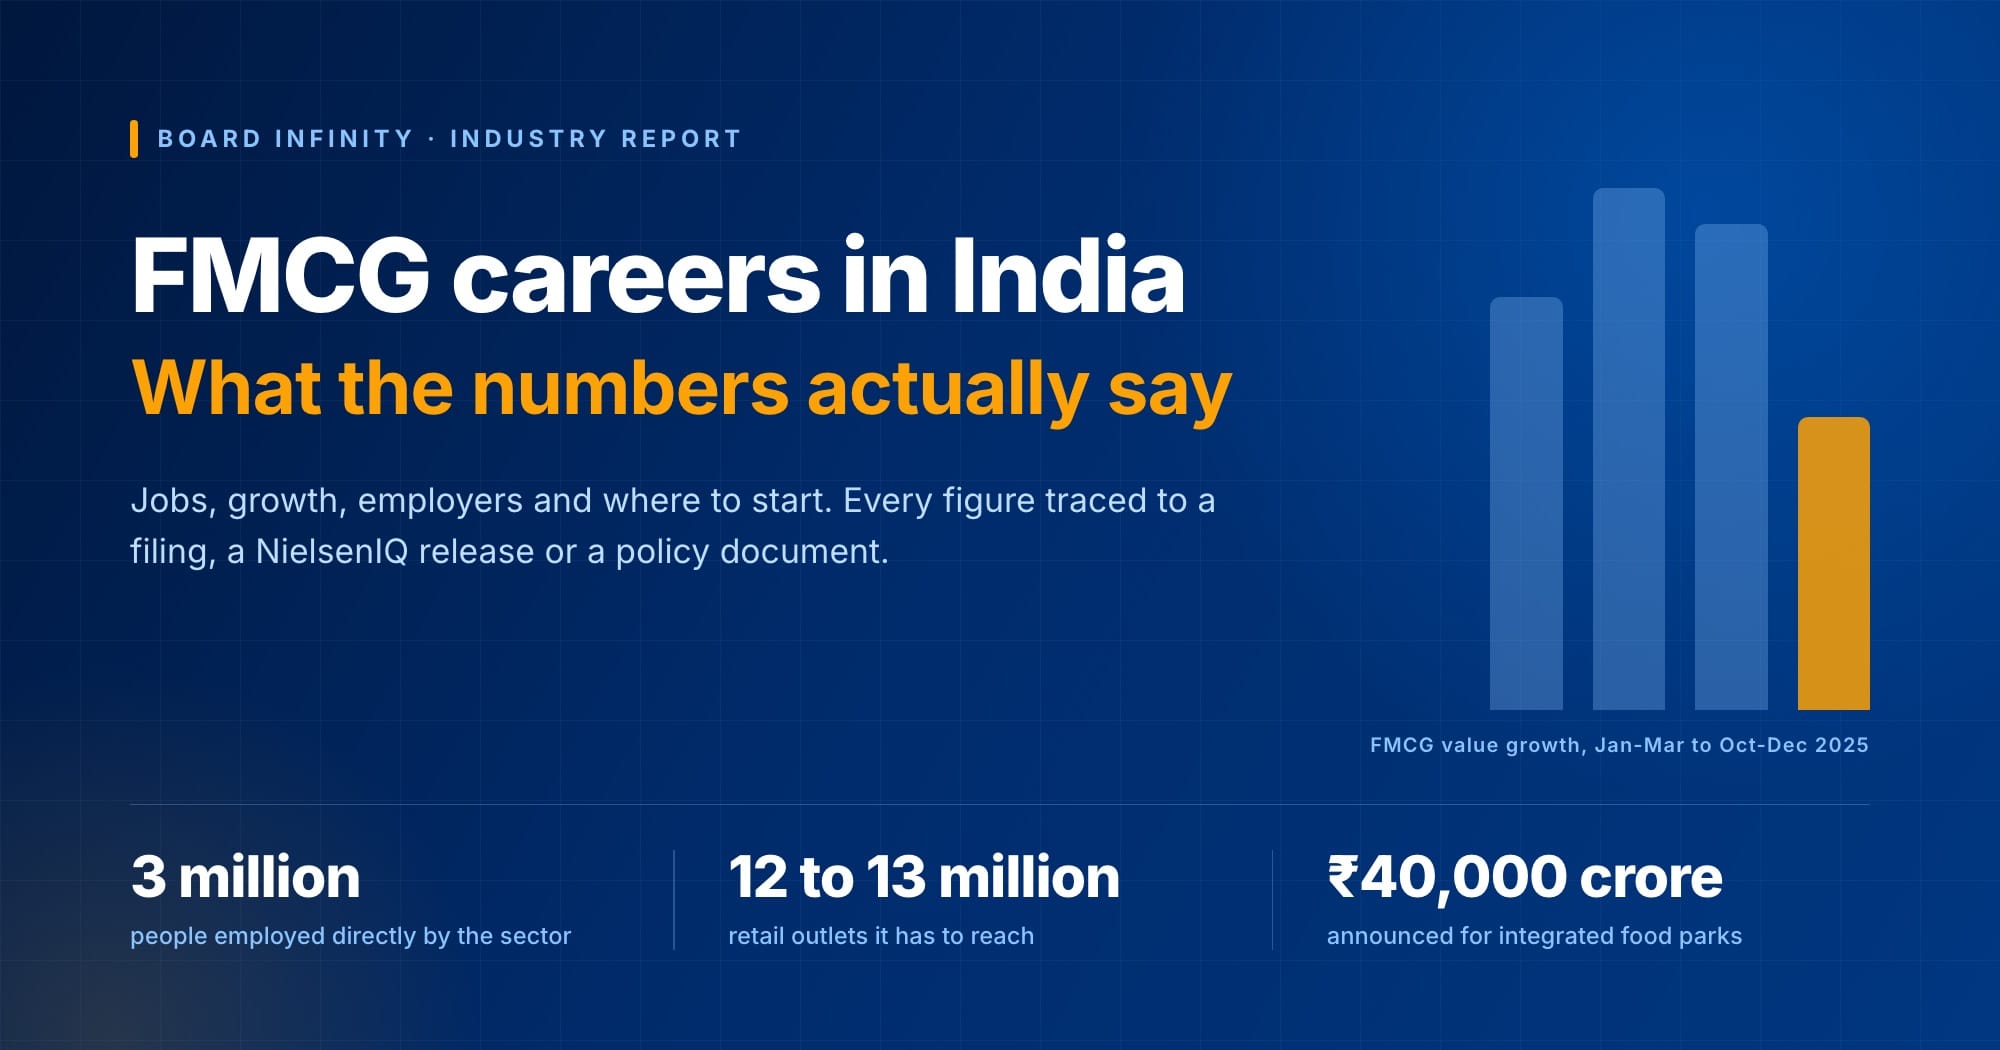
FMCG careers in India: 3 million people employed directly, 12 to 13 million retail outlets, Rs 40,000 crore announced for integrated food parks

Fast-moving consumer goods is one of the few sectors in India that will hand a newcomer a real piece of a business inside two years - a territory with a target, or a slice of a brand with a budget. That is the attraction. What almost nobody tells you before you commit is which part of the sector is actually growing, what the job optimises for, and which skills the sector is currently short of.

This report answers those three questions with numbers that can be checked. Everything below comes from company filings, retail measurement data and policy documents, with the period stated. Start with the one-page brief.

How to read the colours in this report
Every chart below uses the same six colours, and each one always means the same thing.
Scale and the measured coreRevenue, the mature base, quarters actually measured
Channels and how product movesGeneral trade, modern trade, quick commerce, routes to market
Growth, and where the new roles areValue-added and digital-first lines, advertising investment
Cost pressure, and the GST dipCost of goods, input inflation, the Oct-Dec 2025 fall
Policy and the rulesGST, FSSAI, packaging and tax measures
Forecast or context, not measuredThe 2030 projection, gridlines and background
One-page brief on Indian FMCG for someone entering the sector A single-page infographic covering measured sector growth, the employer shortlist, where growth sits, how the sector hires, which skills are scarce, and four decisions to make. FMCG IN INDIA One page on the sector, built for someone deciding whether to join it Board Infinity August 2026 THE SECTOR NOW What was actually measured, not forecast Quarter Value Volume Jan-Mar 25 11.0% 5.1% Apr-Jun 25 13.9% 6.0% Jul-Sep 25 12.9% 5.4% Oct-Dec 25 7.8% 2.6% Then it recovered ~15% listed revenue growth, June 2026 quarter NielsenIQ for the quarters. The widely quoted US$643bn-by-2030 figure is a forecast, not a measurement. WHO LEADS Your employer shortlist, by FY26 revenue and growth Hindustan Unilever 63,763 5% ITC FMCG 24,200 10.1% Nestlé India 23,071 14.9% Varun Beverages 21,685 8.4% Tata Consumer 20,290 15% Britannia 19,150 6.7% Godrej Consumer 15,178 9% Marico 13,611 26% ₹ crore, top eight of the ten shown, each on its own reported basis. Varun Beverages reports on a calendar year. WHERE THE GROWTH IS Not in the core brands - in the adjacency beside them Value-added lines 2 to 5 times faster than the core, in every large portfolio Digital-first brands ITC ~60% growth to ₹1,350 cr run rate; Marico above ₹1,100 cr Protein and health Tata Sampann grew 69% in the March 2026 quarter Quick commerce About 13-14% in the top eight metros, of a 6% urban e-commerce share The single most useful question to ask an employer: which portfolio would I be in, and what was its growth? WHO HIRES, AND HOW Three routes in. Most people try only the first 1 Graduate programme Unilever Future Leaders Programme, plus graduate trainee tracks at ITC, Nestlé India, P&G, PepsiCo, Mondelez, Reckitt, Colgate, Marico, Godrej and more. 2 Company case challenge HUL L.I.M.E., ITC Interrobang, Godrej LOUD, Marico Over The Wall. Fast-tracked hiring, far smaller pool, often the only door if a company skips your campus. 3 Lateral move Growth and commercial roles at quick-commerce platforms, D2C brands and digital-first businesses. Platform economics rather than distribution. SKILLS IN DEMAND Where the sector is currently short of people, and why Platform account work Quick commerce is three years old and growing above 60% a year. Almost nobody has run one of these accounts before. Revenue growth management An input-cost squeeze rewards anyone who can defend a price point pack by pack. Named by ITC, Marico and Britannia in FY26. Reading distribution data ITC reaches 8 lakh outlets through its own platform, HUL 1.4 million retailers. Field roles now execute against data, not instinct. WHAT TO DO WITH THIS Four decisions this report should help you make 1 Pick the portfolio, not the company A 5% core brand and a 26% growth brand are different careers inside the same employer 2 Choose your channel deliberately General trade teaches the craft. Quick commerce and modern trade are where you are scarce 3 Read volume, not revenue Revenue growth without volume growth is repricing, and everyone here knows it 4 Expect field work first Almost every programme starts in sales, usually in a small town. That is the training, not a detour Sources: FY26 company filings, NielsenIQ, KPMG, IBEF, GST Council, MoFPI. Every figure is dated in the report.
Swipe sideways to see the whole chart
The whole report in one image. Each band is expanded in the section of the same name below. If the image is small on your screen: measured value growth was 7.8% in Oct-Dec 2025 and back to about 15% by June 2026; the growth sits in value-added and digital-first lines rather than the core brands; and the three ways in are a graduate programme, a company case challenge, or a lateral move into quick commerce or D2C.
Executive summary of Indian FMCG in FY26 Four columns: what happened, what it cost, where growth is, and what it means for someone joining the sector. WHAT HAPPENED Value growth fell to 7.8% in Oct-Dec 2025 from 12.9%, as the trade destocked and repriced for GST 2.0. It was a plumbing problem, not a demand problem. Listed revenue growth was back to about 15% by June 2026. WHAT IT COST Copra, edible oil, soap noodles and packaging all inflated through the year. Marico grew revenue 26% and still lost about 360 bps of gross margin. Nobody cut advertising, so margin absorbed the hit. WHERE GROWTH IS Value-added and premium lines grew 2 to 5 times faster than the core. Rural leads on volume, urban still holds the value and the premium end. Quick commerce is about 13-14% of sales in the top eight metros, within a 6% urban e-commerce share. WHAT IT MEANS FOR YOU The budgets and the new roles sit in the growth portfolios, not the core brands. Channel skills for quick commerce and modern trade are the scarce ones. Learn to read underlying volume growth. It is the number the sector promotes on.
Swipe sideways to see the whole chart
The one-line version: demand was fine, margins were not, and both the growth and the new roles sit in the adjacency rather than the core.
India FMCG at a glance Eight indicators covering growth, tax reform, channels, margin and scale. India FMCG at a glance 7.8% Value growth Oct-Dec 2025 15% Listed revenue growth Apr-Jun 2026 60% Portfolio repriced by GST 2.0 8 Quarters rural has outgrown urban 70-75% Of sales through general trade 18% E-commerce share top eight metros 23.6% Highest EBITDA margin of the ten largest ₹2.2L cr Combined revenue ten largest players Sources named in the section that discusses each figure. Combined revenue is the ten companies in Section 3.
Swipe sideways to see the whole chart
The combined revenue figure is corporate scale on each company’s own reported basis, not Indian market size.

1. Why look at this sector at all

Three things make FMCG worth a serious look, and one thing should give you pause.

It is enormous and it is everywhere. The sector employs around three million people directly and is India's fourth largest by output. Its factories, depots and distributor networks sit in almost every state, which means the entry-level roles are not concentrated in three cities the way they are in finance or consulting.

It gives responsibility early. Because the work is measured in territories and brands rather than projects, the sector can hand you a defined P&L or a defined target early and see what you do with it. Very few industries can.

It is currently expanding capacity. Announced commitments include ₹40,000 crore for integrated food parks and ₹20,000 crore from a single diversified player. Capacity being built now is hiring two years out.

And the caution: growth in this sector is no longer evenly spread. The largest company grew 5% last year while the fastest grew 26%. Joining the wrong portfolio inside the right company is a real risk, and Section 4 is about exactly that.

The four structural forces behind Indian FMCG Four horizontal bands - demand, structure, policy and capital - each with a headline figure and four supporting facts. What the sector has going for it, in four parts Each band carries the headline number and the evidence behind it DEMAND 7.6% Real GDP growth, FY26 Rural volume growth has beaten urban for eight consecutive quarters Income tax cuts and GST cuts both landed inside one financial year Rural households are still adding categories they never bought before Listed revenue growth was back to about 15% by the June 2026 quarter STRUCTURE 12-13mn Retail outlets served General trade still carries roughly 70 to 75 per cent of all sales A national distribution network takes about a decade to replicate The leaders self-fund growth on a very short cash conversion cycle ITC's eB2B platform alone now reaches more than eight lakh outlets POLICY 5% GST on most FMCG Cut from 18 per cent on 22 September 2025 across most of the basket About 60 per cent of the FMCG portfolio saw a rate revision ₹10,900 crore production-linked incentive for food processing to 2027 Crude edible oil import duty halved to 10 per cent in June 2025 CAPITAL ₹40,000cr Largest single commitment Announced by Reliance Industries for integrated food parks, over 3 years ITC has committed ₹20,000 crore over five to six years About ₹17,200 crore announced across five other majors combined Two-thirds of sector acquisitions from FY21 to FY25 were D2C brands
Swipe sideways to see the whole chart
Demand and structure are why the sector keeps hiring. Policy and capital are why it is expanding capacity right now.

2. How big it is, and how fast it is really growing

You will see one number quoted everywhere: the Indian FMCG market is worth about US$289 billion and heading for US$643 billion by 2030 at a 17.3% compound rate. That is a forecast published by IBEF, and it is worth knowing. It is not a measurement.

What has actually been measured is on the right of the chart below, and it is a different story: value growth between 7.8% and 13.9% across the last four measured quarters, with volume growth below 7% throughout.

Indian FMCG market size forecast against measured growth Left: a bar chart of the projected market size from 289 billion dollars in FY25 to 643 billion by FY30 at a 17.3 per cent CAGR. Right: a table of actually measured quarterly value and volume growth. Market size: the forecast, and what has been measured Projected market size, US$ billion 289 FY25 643 FY30 forecast 17.3% CAGR Source: IBEF. A forecast, not a measurement. What was actually measured Quarter Value Volume Jan-Mar 2025 11.0% 5.1% Apr-Jun 2025 13.9% 6.0% Jul-Sep 2025 12.9% 5.4% Oct-Dec 2025 7.8% 2.6% NielsenIQ. Oct-Dec volume: rural 2.9 / urban 2.3.
Swipe sideways to see the whole chart
Both panels are real, and they say different things. The left is a forecast published by IBEF; the right is what NielsenIQ measured at the shelf. Quote the right-hand panel and state the quarter.

Why this matters to you and not just to analysts. If you walk into a conversation about this sector quoting a 17% growth rate, anyone who works in it knows immediately that you have read a slide and not a result. The useful habit is the opposite: name the quarter, name the source, and know the difference between value and volume. That single discipline separates people who have read about the sector from people who could work in it.

FMCG value growth by quarter, calendar 2025 Bar chart of year on year FMCG value growth: 11.0 percent in Jan-Mar 2025, 13.9 percent in Apr-Jun 2025, 12.9 percent in Jul-Sep 2025, and 7.8 percent in Oct-Dec 2025. 0% 5% 10% 11.0% 13.9% 12.9% 7.8% Jan-Mar 25 volume 5.1% Apr-Jun 25 volume 6.0% Jul-Sep 25 volume 5.4% Oct-Dec 25 rural 2.9 / urban 2.3 GST 2.0 took effect 22 September 2025
Swipe sideways to see the whole chart
Year on year FMCG value growth, NielsenIQ retail measurement. The December 2025 fall is a transition effect, not a demand collapse: the trade destocked and repriced ahead of the new GST rates.

The dip in the December 2025 quarter is the most instructive event in recent memory, and it was not a demand collapse. When GST rates were cut on 22 September 2025, every unit already sitting with a distributor or retailer carried an old printed price and had to be repriced, credited or returned. NielsenIQ found roughly 60% of the portfolio saw a rate revision. By the June 2026 quarter, listed revenue growth was back to around 15%, and Hindustan Unilever posted its strongest quarter in thirteen quarters.

Rural versus urban FMCG volume growth Paired bars. April to June 2025: rural 8.4 percent, urban 4.6 percent. October to December 2025: rural 2.9 percent, urban 2.3 percent. 0% 3% 6% 8.4% 4.6% 2.9% 2.3% Apr-Jun 2025 Oct-Dec 2025 Rural Urban Rural has led urban for eight straight quarters
Swipe sideways to see the whole chart
Volume growth, year on year. Rural still leads, but the lead compressed from 3.8 percentage points to 0.6 in two quarters. That compression is the single most important thing to watch through FY27.

Rural volume growth has beaten urban for eight consecutive quarters, but the gap has compressed from 3.8 percentage points to 0.6 in two quarters. Rural is where the volume growth is; urban still holds about 62% of value, the premium end and nearly all of e-commerce. Which half of that split a role sits on changes the job considerably.

3. Who leads, who is stuck, and what that tells you

This is the single most useful table in the report if you are choosing an employer. Revenue tells you the scale of the machine you would join. The growth pill tells you whether budgets and new roles are expanding or being defended.

FY26 revenue and growth for the ten largest FMCG players A bar chart of FY26 revenue for the ten largest listed FMCG players with a growth pill beside each. FY26 revenue and growth, the ten largest players Revenue in ₹ crore. The pill is full-year growth. Hindustan Unilever 63,763 5% ITC FMCG segment 24,200 10.1% Nestlé India 23,071 14.9% Varun Beverages 21,685 8.4% Tata Consumer 20,290 15% Britannia 19,150 6.7% Godrej Consumer 15,178 9% Marico 13,611 26% Dabur 13,193 5% Colgate-Palmolive 5,984 flat Each company on its own reported basis for the year ended 31 March 2026, except Varun Beverages, which reports on a calendar year.
Swipe sideways to see the whole chart
Scale and growth have decoupled. The largest player grew 5%; the fastest grew 26%. For anyone joining the sector, the growth column is where the new budgets and roles sit.

Two patterns are worth carrying into any conversation about this sector. Scale and growth have decoupled - a ₹64,000 crore base cannot grow at 26% because it already sells to nearly everyone. And profit growth outran sales growth almost everywhere, which is the signature of a sector managing cost and mix rather than riding demand. That is the environment you would be hired into.

4. Where the growth actually sits

A widely circulated split puts household and personal care at 50% of Indian FMCG, healthcare at 31% and food and beverages at 19%. Treat it with suspicion: it contradicts the revenue mix of the sector's own largest companies, in which food and beverages is by far the biggest block. What can be evidenced is category performance, and the FY26 pattern is unambiguous.

The first two rows are the mature core; the seven below are the value-added adjacency, and they grow two to five times faster. This is why almost every company now reports a separate growth or digital-first portfolio - and it is the most important question to ask any prospective employer. Not what does the company do, but which portfolio would I be in, and is it growing at 5% or 26%.

"Which part of the portfolio would this role sit in, and what was its growth last year?" Almost nobody asks it. The answer tells you whether you will spend two years defending a mature brand or building a new one, and both are legitimate - but they are very different careers.

5. How a product reaches a consumer, and the jobs that do it

An FMCG company does not sell to consumers. It sells to a distributor, who sells to a retailer, who sells to a consumer. Almost every entry-level role in the sector exists somewhere on that chain, so it is worth understanding before you pick one.
Route to market: four parallel paths from factory to consumer A diagram showing a manufacturer feeding four channels: general trade via distributors and wholesalers to kirana stores, modern trade via distribution centres to supermarkets, e-commerce and quick commerce via warehouses and dark stores, and direct to consumer. Factory and depot Distributor, then wholesaler 12 to 13 million kirana outlets 70-75% Chain distribution centre Supermarkets and cash and carry Warehouse and dark store Quick commerce and e-commerce Direct to consumer: own site, marketplace, courier Small share of volume, disproportionate share of learning
Swipe sideways to see the whole chart
The same product travels four roads to four shelves at four different margins. Managing the conflict between those roads is a large part of what commercial teams in this sector do.
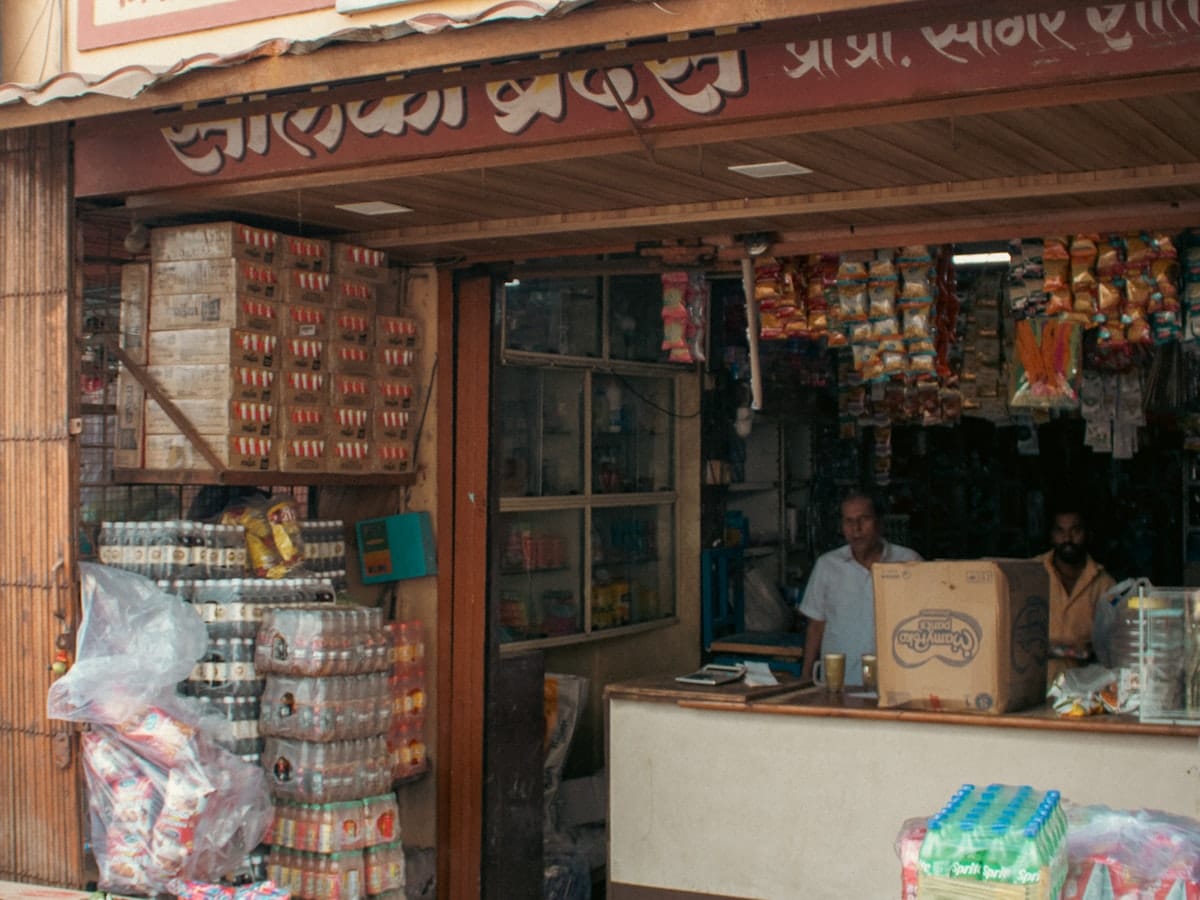
A neighbourhood kirana store in India with packaged goods stacked outside
The sector’s actual unit of distribution. India has 12 to 13 million outlets like this one, and they still carry roughly 70 to 75 per cent of FMCG sales. Photograph: Unsplash

Four terms run through every conversation in this sector. Numeric distribution is the share of stores stocking a product; weighted distribution weights those stores by category sales. Primary sales are what the company invoices to distributors; secondary sales are what distributors invoice to retailers; offtake is what consumers actually buy. When primary grows and offtake does not, inventory is piling up in the trade and it will reverse - which is exactly what the December 2025 quarter recorded.

The chain has also been instrumented in the last three years, and this has changed the entry-level job. ITC's UNNATI platform covers more than eight lakh outlets and generates hyperlocal recommendations for individual retailers; Hindustan Unilever's Shikhar app carries around 1.4 million retailers. A salesperson today walks into a shop already knowing which three products that specific shop is likely to reorder. The work has shifted from persuasion towards reading data and executing against it.

6. The channel shift, and the skill it created

This is the part of the sector that has changed fastest, and the part where employers are shortest of people.
E-commerce share of FMCG sales by market tier Horizontal bars: urban India overall 6 percent, all metros 14 percent, top eight metros 18 percent, southern metros above 21 percent. E-commerce share of FMCG sales, by market Quick commerce is more than three quarters of this Urban India, overall 6% All metros 14% Top eight metros 18% 21%+ Southern metros The channel is not national yet
Swipe sideways to see the whole chart
NielsenIQ, October to December 2025. Quick commerce is very large in eight cities and close to invisible in the other several thousand towns, which is why general trade still carries the sector.
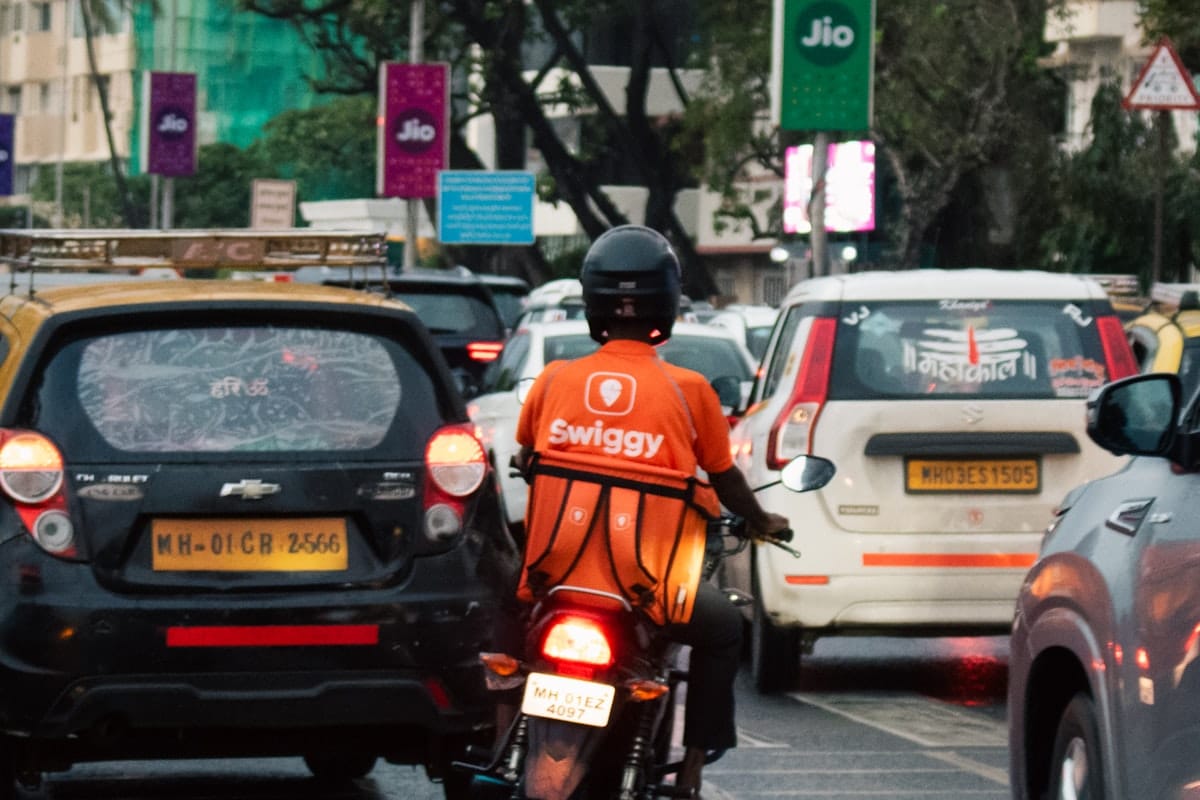
A delivery rider on a motorcycle in Mumbai traffic
The channel that changed the sector’s economics in three years. Quick commerce is now more than three-quarters of all e-commerce FMCG sales, and it is concentrated in about eight cities. Photograph: Unsplash

Blinkit ended FY26 with 2,243 dark stores, after 216 net additions in the March quarter alone, and posted its first meaningfully positive quarterly adjusted EBITDA at ₹37 crore. Parent Eternal reported business-to-consumer net order value of ₹26,880 crore in that quarter, up 54%, and has guided to above 60% compound growth for three years. On Datum Intelligence estimates from January 2026, Blinkit held about 46% share, Swiggy Instamart 24% and Zepto 22%.

The career point. Traditional trade still carries the volume, so that is where most roles are and where the sector's core craft is learned. But quick commerce and modern trade are where employers are hiring fastest and where fewest people have real experience. If you can run a platform account - listings, content, promotion economics, retail media spend - you are scarce right now. That is a genuine and currently open window.

Eternal's March 2026 quarter revenue rose 196% year on year. Almost none of that is demand. Blinkit moved from a marketplace model, where only commission is booked as revenue, to an inventory-led model, where the full value of goods sold is booked. The economics barely changed; the accounting did. Before you interpret any growth rate in this sector, establish whether the business changed or the accounting did.

7. How the money is made, and what you will be measured on

This section exists for one reason. Whatever role you take in this sector, your work will be judged by its effect on one of the four lines below. Knowing which line your job moves is the difference between doing tasks and running a business.

Where every hundred rupees of FMCG revenue goes A single stacked bar splitting one hundred rupees of revenue into cost of goods sold, advertising, overheads and EBITDA, with the observed range for each. Where every ₹100 of FMCG revenue goes Typical ranges across FY26 disclosures; the bar shows midpoints, rounded to ₹100 50 10 21 19 Cost of goods sold ₹43-57 Highest in commodity foods Advertising ₹8-12 Never the first line to be cut People, freight, overheads ₹17-25 Salaries, distribution, freight EBITDA ₹11-24 HUL 23.6 FY26; Marico 15.6 Q4 FY26
Swipe sideways to see the whole chart
Ranges are drawn independently across companies; the bar shows their midpoints, rounded so the four segments sum to ₹100. The line to notice is advertising: bigger than most people expect, and protected even in a bad margin year.

Where a company sits on that split is decided by what it sells, and the spread across FY26 was wide.

That spread answers a question the sector is asked constantly: why do personal care businesses earn roughly twice the margin of food businesses? A shampoo's raw material is a small fraction of its price and the brand carries the rest. A biscuit's raw material is wheat, sugar and palm oil, and the consumer has a firm intuition about what a packet should cost.

Two lines deserve precision because they shape day-to-day work. Advertising runs at 8% to 12% of revenue and is not discretionary - Marico spent about ₹1,300 crore in FY26 and raised it 5% in the very quarter its gross margin was falling fastest. Trade spend hides inside revenue, not inside expenses - discounts and retailer schemes are generally netted off revenue, so a company buying volume with promotions looks as though it has weak pricing rather than high costs. If your role touches promotions, that is the number you are moving.

8. What is being built, and where

Announced capacity is the closest thing to a hiring forecast the sector publishes. Plants being built now need people in two years.
Announced FMCG capital commitments in India Horizontal bars of announced investment: Reliance Industries 40,000 crore for food parks over three years, ITC 20,000 crore over five to six years, five other majors combined about 17,200 crore, Reliance Consumer Products 8,000 crore, Varun Beverages 3,500 crore, Hindustan Unilever 2,000 crore. Announced capital commitments, and over what period Reliance Industries ₹40,000 cr, 3 years ITC ₹20,000 cr, 5-6 years Five other majors combined ₹17,200 cr, combined Reliance Consumer Products ₹8,000 cr, 12-15 mths Varun Beverages ₹3,500 cr, new plants Hindustan Unilever ₹2,000 cr, 2 years Bar length is the headline rupee figure only. Periods differ, so these are not comparable annual run rates.
Swipe sideways to see the whole chart
The combined bar aggregates separately announced plans by Nestlé, Mondelez, Britannia, Tata Consumer and Procter & Gamble. ITC’s and Hindustan Unilever’s commitments are shown separately above and are not included in it.
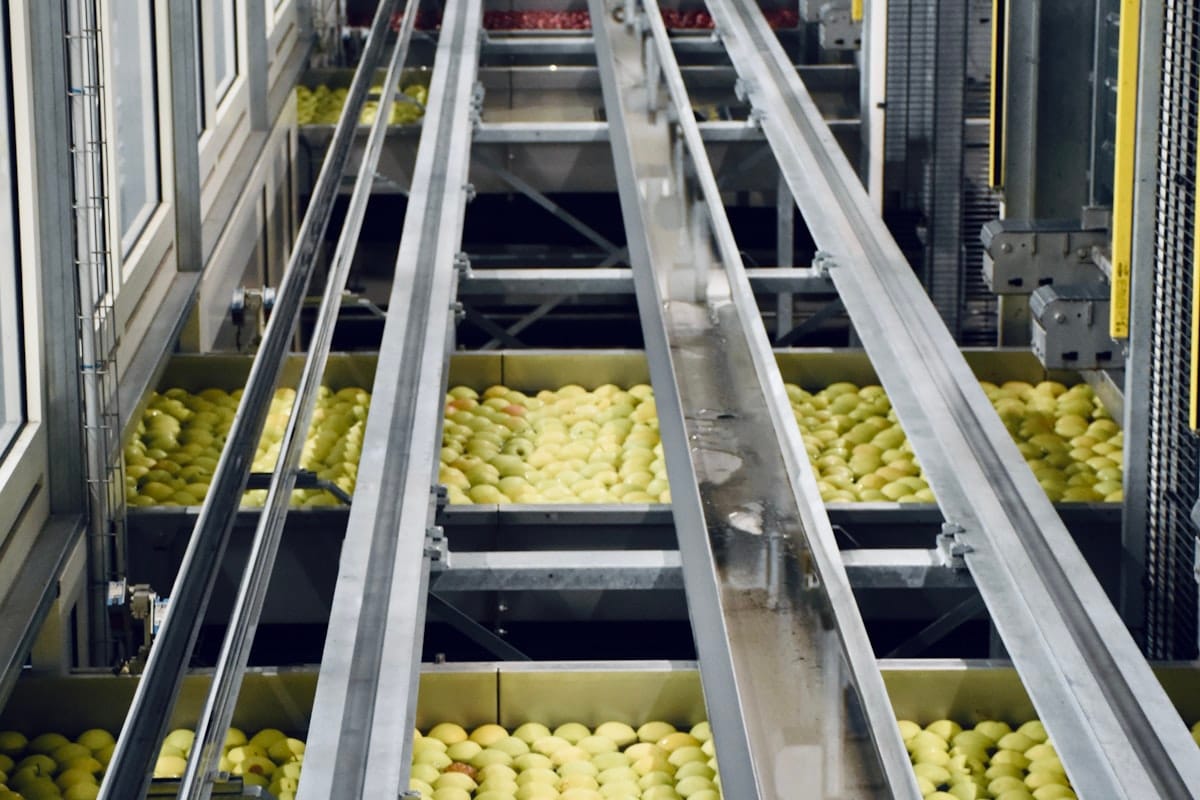
Conveyor lines inside a food processing plant
Where the announced capital is going. Food processing has drawn about US$15.9 billion of cumulative FDI since April 2000 (IBEF, to December 2025). Photograph: Unsplash

The largest single commitment is not from a traditional FMCG company. Reliance Industries announced ₹40,000 crore over three years for integrated food parks in August 2025, and Reliance Consumer Products a further ₹8,000 crore for 10 to 12 beverage plants. Meanwhile the incumbents are buying growth as much as building it - and two-thirds of the sector's acquisitions between FY21 and FY25 were direct-to-consumer brands.

Building a digital-first brand inside a large company is slow and culturally difficult, so buying one that has proven product-market fit and pushing it through an existing distribution network is faster. For anyone entering the sector this creates a specific kind of role: small acquired teams inside large companies, with unusually wide ownership.

Where FMCG capacity is concentrated
Major FMCG manufacturing centres named by IBEF, listed alphabetically and not ranked
Chandigarh belt
Fiscal-incentive manufacturing clusters. A union territory, not a state
Gujarat
Edible oil and chemicals processing, port access
Maharashtra
Demand density, ports and the largest modern-trade base
Punjab
Agri sourcing, dairy and staples processing
Tamil Nadu
Food and personal care plants, southern demand
IBEF names these as major FMCG centres and does not rank them by size.
Locations per IBEF; not ranked, and Chandigarh is a union territory rather than a state. Location logic from company disclosures: ITC runs 12 integrated manufacturing and logistics facilities sited close to large demand centres, with ancillary units at Pudukkottai in Tamil Nadu and Kapurthala in Punjab.

Capacity clusters where three things overlap: fiscal incentives, agricultural sourcing, and short freight distance to a large consuming population. The logic has shifted over the last decade from chasing tax exemptions towards cutting distance to market - ITC now runs 12 integrated manufacturing and logistics facilities placed close to demand centres. If you are considering a supply chain or manufacturing role, that list is where the work is.

Foreign capital points the same way: food processing has drawn about US$15.9 billion of cumulative FDI since April 2000 (IBEF, to December 2025), which is why the biggest announced programmes are food parks rather than personal care plants - and why food and beverages, not personal care, is where most new manufacturing and supply chain roles will appear.

9. The rules you will work inside

Policy moved more in FY26 than in any year since 2017, and in both directions.

Government policy levers acting on Indian FMCG Four cards: GST on most FMCG at 5 per cent, a 10,900 crore rupee food processing incentive outlay, crude edible oil duty halved to 10 per cent, and 278 processing units approved. Four policy levers now working on the sector 5% GST on most FMCG down from 18%, Sep 2025 ₹10,900 cr Food processing PLI outlay for 2021-27 10% Crude edible oil duty halved in June 2025 278 Units approved under the PLI by Jun 2025 Sources: GST Council notifications, 22 Sep 2025; MoFPI; Press Information Bureau, June 2025.
Swipe sideways to see the whole chart
Three of these four lower the sector’s cost base or its shelf prices. The fourth builds the capacity to supply the demand they create.

GST 2.0, effective 22 September 2025, cut most of the FMCG basket from 18% to 5%. Shelf prices moved: Kissan Ketchup 850g from ₹100 to ₹93 and BRU 75g from ₹300 to ₹270, both Hindustan Unilever; and Procter & Gamble's Pantene 340ml from ₹410 to ₹355. About 40% of Hindustan Unilever's portfolio saw price cuts, and roughly half of Dabur's consolidated sales qualified.

The mechanism matters more than the list, because a rate cut does not simply make the manufacturer richer.

And the direction was not uniform. From 1 February 2026, cigarette tax moved from 28% of transaction value to 40% of retail sale price. ITC called the increase unprecedented and warned it would widen the arbitrage funding illicit trade, already estimated to cost the exchequer around ₹23,000 crore a year.

The direction of travel is worth stating plainly: the next compliance cost in this sector is about what is printed on the pack and what happens to it afterwards, not what is inside it. Advertising is also policed more tightly than it used to be - the CCPA and ASCI have both tightened enforcement on health, nutrition and ayurveda claims, which is a live constraint on anyone writing a brand claim.

10. What could go wrong

Read this as a list of things to watch rather than reasons to stay away. Most of these are supply-side or policy risks rather than a collapse in demand.

The risk company filings name most often is input cost, not consumer demand. None of these is a reason to avoid the sector. They are the reason margin literacy is currently a hireable skill, and the reason the growth portfolios are the safest place to sit.

11. One company's year, in detail

Grew revenue 26%, its fastest in fourteen years, and delivered its best India volume growth in seven years - while gross margin fell about 360 basis points and EBITDA margin went down, not up.

Marico's core is Parachute coconut oil and Saffola edible oils, both directly exposed to agricultural commodities. Copra ran hard through FY26. A single-cause account would say the company raised prices. Four things happened at once, and this is what commercial work in this sector actually looks like.

EBITDA and profit each grew 14%, well below the 26% revenue growth. EBITDA margin was 15.6% in the March quarter, down about 114 basis points. More than 95% of the business gained or held market share on a moving-annual-total basis.

What it establishes. Growth and margin trade against each other over a one-to-two-year horizon, and management has to choose which to defend. Marico chose share and brand investment, and said so. If you are ever asked whether a company had a good year, the answer needs three things together: the growth, the margin, and a view on whether the trade between them was right.

12. Latest news

The sector restates itself every quarter. These are the developments that have actually moved something in the last eighteen months, most recent first.

Read one quarterly results release in full each week rather than a summary of it, rotating through Hindustan Unilever, ITC, Marico, Dabur, Nestlé India, Britannia, Tata Consumer and Godrej Consumer. Company investor relations pages carry them free. Note two things each time: underlying volume growth, and one sentence of management commentary on input costs or channel mix. Twenty minutes a week keeps you genuinely current.

13. The jobs themselves

The sector hires into general management tracks on a specific promise: real responsibility early. That promise is genuine, and so is its cost - the first eighteen months are usually harder and less glamorous than expected, and almost always include a field sales stint in a small town.

One caveat before the tables below. Programme names and intake sizes change from year to year, and no public source tracks them reliably. Treat the routes named here as the starting point for your own checking, not as a current vacancy list, and confirm against each company's own careers page in the season you are applying.

Three routes into the FMCG sector Three bands describing the graduate programme, the company case challenge, and the lateral route into quick commerce and direct-to-consumer businesses. Three ways in, and what each one actually is Most people try only the first 1 GRADUATE PROGRAMME Unilever Future Leaders Programme, and the equivalent trainee tracks at ITC, Nestle India, P&G, PepsiCo, Mondelez, Reckitt, Colgate, Marico, Godrej Consumer, Britannia, Dabur, Tata Consumer and Coca-Cola India. Rotational, structured, with a defined path to independent charge. 2 CASE CHALLENGE HUL L.I.M.E., ITC Interrobang, Godrej LOUD, Marico Over The Wall and L'Oreal Brandstorm all carry fast-tracked hiring routes. Often the only door where a company does not recruit at your institution, and the applicant pool is far smaller relative to the offers it carries. 3 LATERAL MOVE Growth, category and commercial roles at quick-commerce platforms, direct-to-consumer brands and digital-first businesses. Less structured and more volatile than a graduate programme. Builds platform economics rather than distribution economics.
Swipe sideways to see the whole chart
The case-challenge route is the most underused of the three, and the one with the smallest applicant pool relative to the offers it carries.
Career paths in FMCG Three entry routes converge into a graduate trainee year, which fans out into sales, brand and supply chain tracks, which reconverge at general management. Graduate leadership programme Company case challenge, fast-tracked Lateral: D2C or quick commerce Trainee year: rotations, almost always including a field sales stint Sales Territory, then region, then the country Brand and category Own a brand, then a portfolio Supply and commercial Planning, revenue growth management, finance General management, or a founding commercial role at a D2C or platform business
Swipe sideways to see the whole chart
Three routes in, three tracks through, one point of convergence. The tracks are not sealed: moving from sales into brand after three to four years is common, and is usually a deliberate development plan rather than a sideways step.

Who hires, and what each one teaches you

Growth is from Section 3. The named routes are the ones that are publicly identifiable; every company in this list also runs a graduate trainee track, and where a company runs a named case challenge it is usually the smaller applicant pool of the two.

What the first year actually looks like

Sales or brand

The question people most want answered, and rarely get straight.

Neither is better. The useful distinction is that sales teaches how the sector actually works, and brand teaches how to decide what it should do. Most people who reach general management have done both, and those who did sales first tend to be stronger at brand than the reverse.

Compensation numbers for Indian FMCG roles on career sites and aggregator blogs are almost entirely unsourced and frequently wrong by a wide margin. This report deliberately does not publish a table of them. The reliable sources are your own institution's audited outcome report and people one or two years ahead of you in the same function. Any figure you cannot trace to one of those is noise.

14. The numbers to learn, and what to do next

Eight terms carry specific meanings in this sector and are used loosely almost everywhere else. Learning them properly is the cheapest way to sound like someone who already works here.

Never judge a company in this sector on revenue growth. Revenue growth without volume growth is repricing, and everyone who works here knows it. State the volume number first, then price and mix, then the margin. If you only remember one number about a company, make it underlying volume growth.

Every figure in this report is traceable to a company filing, a NielsenIQ release, a KPMG sector report, IBEF, or a government notification, with the period stated in the text. Data is current as of August 2026. This sector restates itself every quarter, so treat anything older than two quarters as context rather than fact.

Industry Reports FMCG

Mark as Read