
Measuring Supply Chain Emissions and Setting a Baseline
The awkward moment comes when a supplier says, “Our factory is efficient,” but nobody can tell you the emissions in the steel, packaging, trucking or purchased electricity behind the product. That is why carbon baselining matters: without a credible starting line, every “green supply chain” claim is just a slogan.
- Supply chain emissions measurement means converting activity data - fuel, electricity, materials, freight, waste - into CO2-equivalent using emission factors.
- The baseline is the reference-year emissions inventory against which future reductions are measured.
- Use the GHG Protocol scopes: Scope 1 is owned operations, Scope 2 is purchased energy, Scope 3 is upstream and downstream value chain emissions.
- The basic formula is: GHG emissions = activity data x emission factor x global warming potential adjustment, where needed.
- Start broad with spend or average data, then improve accuracy using supplier-specific and process-level data.
- A good baseline is complete, consistent, auditable, decision-useful and repeatable - not necessarily perfect on day one.
- The interview trap is confusing decarbonisation actions with measurement discipline. First measure the footprint, then prioritise reduction levers.
Big Picture: The Baseline Is the Carbon P&L of the Supply Chain
Think of a supply chain emissions baseline like a profit and loss statement, but for greenhouse gases. It tells you where emissions are created, which activities drive them, which suppliers matter most and whether future reductions are real or just boundary changes.
Core Explanation: How to Measure Supply Chain Emissions
The big idea is simple: measure physical or financial activity, multiply it by the right emission factor, and organise the result by scope, category, geography, supplier and product. The difficulty is not the arithmetic. It is deciding what belongs in the boundary, collecting usable data and keeping the method consistent year after year.
The standard calculation logic is:
Emissions in tCO2e = activity data x emission factor
For example, activity data could be litres of diesel consumed, kWh of purchased electricity, tonnes of aluminium bought, tonne-kilometres moved or rupees of spend in a category. Emission factors translate those activities into greenhouse gas emissions expressed as carbon dioxide equivalent, or CO2e.
The Three Scopes You Must Get Right
- Scope 1: Direct GHG emissions from sources owned or controlled by the company, as defined by the GHG Protocol Corporate Standard.
- Scope 2: Indirect emissions from purchased electricity, steam, heating or cooling consumed by the company, under the GHG Protocol Corporate Standard.
- Scope 3: Other indirect value-chain emissions, including purchased goods, logistics, business travel, use of sold products and end-of-life treatment, under the GHG Protocol Scope 3 Standard.
In supply chain roles, Scope 3 usually receives the most attention because it sits outside the company’s factory gate but inside its economic influence. Purchased materials, contract manufacturing, inbound freight, outbound distribution and supplier energy choices often sit here.
Data Quality Ladder: From Estimate to Decision-Grade Baseline
Do not wait for perfect supplier data before starting. Build a baseline with the best available method, disclose assumptions internally, then improve the data quality where it changes decisions.
The lowest rung is spend-based estimation: rupees spent in a category multiplied by an environmentally extended input-output factor. It is useful for screening, but weak for operational decisions because price changes can look like emissions changes. The strongest data is supplier-specific primary data, where a supplier reports the footprint of the material, component or service you actually buy.
In Indian manufacturing, procurement teams are often the bridge between sustainability ambition and real supplier evidence. Adding emissions questions to RFQs, supplier scorecards and audits works best when procurement already understands ownership, supplier economics and compliance risk. If that feels unfamiliar, revise what procurement owns and how it creates value before studying carbon baselines.
Six Metrics to Track in a Supply Chain Emissions Baseline
A baseline is only useful if it can be tracked. In interviews, name the metric, give the formula and explain what “good” means without pretending that every industry has the same benchmark.
Worked Example: Building a Simple Freight Emissions Baseline
Suppose a company ships 10,000 tonnes of finished goods over an average distance of 500 km by road in the baseline year.
Step 1: Calculate tonne-kilometres.
10,000 tonnes x 500 km = 5,000,000 tonne-km
Step 2: Apply an emission factor.
If the road freight factor used by the company is 0.08 kg CO2e per tonne-km, then:
5,000,000 tonne-km x 0.08 kg CO2e = 400,000 kg CO2e
Step 3: Convert to tonnes.
400,000 kg CO2e ÷ 1,000 = 400 tCO2e
Interview insight: The answer is not complete until you mention the assumptions: shipment weight, distance, mode, load factor, empty return movement and emission factor source.
Five-Step Process to Set a Credible Baseline
A useful baseline also needs governance. Finance should reconcile spend and activity data, procurement should validate supplier inputs, operations should validate physical consumption and sustainability should own methodology. Supplier emissions data also belongs in supplier evaluation, not in a separate ESG folder. That is why carbon questions increasingly appear inside supplier selection, scorecards and evaluation.
Where to Prioritise: Materiality and Data Confidence
Not every category deserves the same effort. A category that is high-emission and low-confidence should be your first improvement zone, because both the business risk and the measurement uncertainty are high.
Case Study: Tata Motors and the Value-Chain Baseline Challenge
Tata Motors shows why vehicle companies cannot stop at factory emissions - a credible baseline must connect manufacturing, suppliers, logistics, vehicle use and end-of-life impacts.
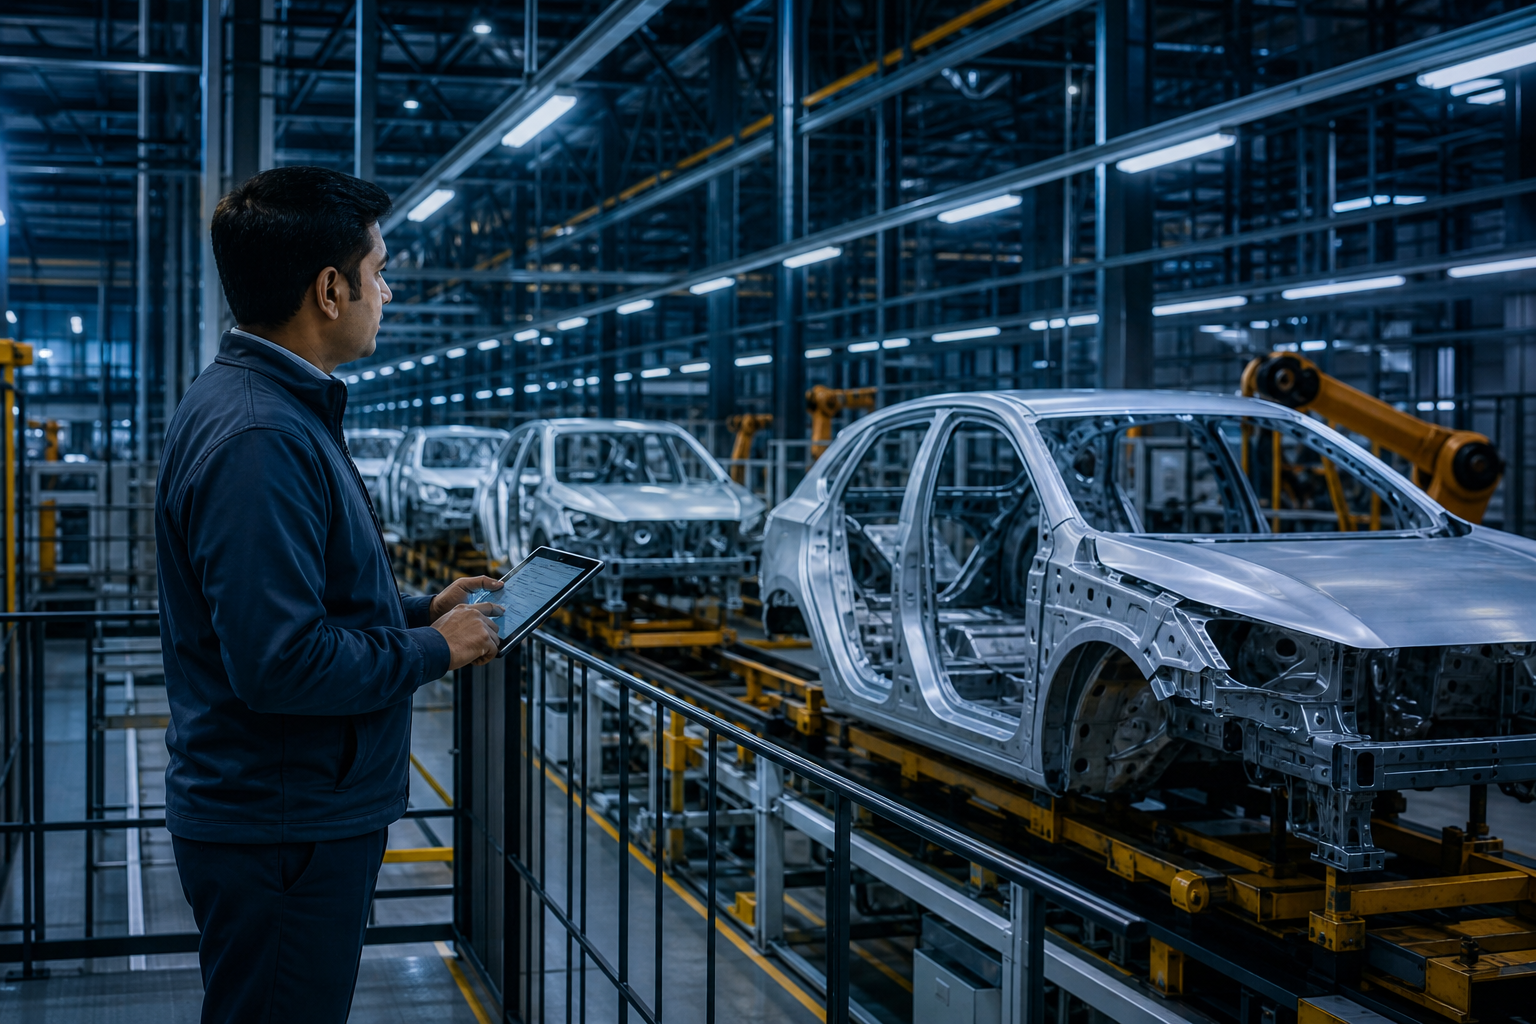
Situation. An automaker’s operational emissions from plants are visible, but the supply chain footprint is more complex. Purchased steel, aluminium, plastics, batteries, components, inbound logistics, dealer distribution and the use phase of vehicles all influence the total value-chain footprint.
The move. Tata Motors reports sustainability and business responsibility information through its public annual reporting, including climate-related disclosures and value-chain considerations on its investor reporting platform (Tata Motors annual reports). The important management lesson is not merely disclosure. It is the discipline of separating emissions into operational energy, purchased goods, logistics and downstream product impacts so that each owner - manufacturing, procurement, logistics, product engineering and suppliers - can act on the right driver.
The result or lesson. The primary driver of a useful baseline in automotive is life-cycle visibility: understanding where emissions occur before, during and after manufacturing. Supporting drivers include supplier data collection, material-level analysis, plant energy tracking, logistics measurement and product portfolio choices. A shallow answer says, “Make more EVs.” A strong answer says, “First build the baseline by scope and life-cycle stage, then choose decarbonisation levers category by category.”
How AI Changes Measuring Supply Chain Emissions and Setting a Baseline
AI is changing carbon baselining in three practical ways.
- Document extraction from messy supplier evidence: AI can read invoices, utility bills, freight documents and supplier sustainability files, then extract activity data such as kWh, litres, tonnes, origin-destination and material grade. Human review is still needed because a wrong unit can distort the baseline.
- Spend classification and emission-factor mapping: Machine learning can classify procurement spend into categories and suggest emission-factor matches. This is useful for screening Scope 3, but the method must be reviewed by category managers because supplier-specific reality may differ from category averages.
- Anomaly detection in emissions data: AI can flag unusual jumps in freight emissions, energy consumption or supplier-reported footprints. The value is not automatic reporting - it is faster investigation of outliers before the baseline is locked.
Load this lesson, a company annual report and one supplier sustainability report into NotebookLM. Ask: “Create a Scope 1, Scope 2 and Scope 3 baseline checklist for this company, identify likely missing data, and draft five interview questions on its supply chain emissions risks.”
If you want to connect carbon baselining with procurement analytics, the natural next step is using AI in spend analysis, sourcing and contract review, because emissions data increasingly sits inside spend, supplier and contract systems.
Interview Relevance
“You are advising an Indian FMCG company that wants to reduce supply chain emissions. How would you measure its current emissions and set a baseline before recommending actions?”
Use this line in interviews: “I would not begin with solutions. I would first build a boundary-consistent baseline, identify the largest and least certain categories, and then link reduction levers to accountable owners.”
Common Mistake
The mistake: jumping straight to “use EVs, renewable energy and recyclable packaging” without showing how the baseline is measured. Why it costs candidates: it sounds enthusiastic but not managerial, because you cannot prove impact without scope, activity data, emission factors and a baseline year. Fix: always answer in this order - boundary, scopes, data, calculation, validation, then levers.